“You can’t have a mid-life crisis in the airline industry, because everyday is a crisis.” – Herb Kelleher
Maintaining an airline is a mess. From ensuring flight safety and regulators’ compliance to providing delicious meals, battling global uncertainties to keeping airfares competitive, every system must work like a Swiss watch to ensure on-time performance.
However, in the pursuit of keeping their operational costs lower, airlines often compromise on one element that has become the crucial competitive differentiator – customer experience.
This article explores how one can use Net Promoter Score to dig deeper into customer issues and deliver better experiences. While there’s high competition in the aviation sector, it’s ripe for disruption, as customers are now ready to pay a premium for availing of better services.
But before we dive deep into the NPS® competitive analysis, let’s first understand why airlines, as an industry, trails other verticals in delivering customer satisfaction.
Why Do Airlines Have Low Customer Satisfaction Ratings?
While customer satisfaction ratings for US airlines have reached a peak not seen in over 20 years, scoring 76 out of a possible 100 on a scale, the industry still lags behind other verticals in delighting its customers.
In 2020, according to Qualtrics, the airline industry recorded an average NPS of -1, the second-lowest score in the benchmarks and 13 points lower than the average NPS score of all sectors. At the same time, the Satmetrix report for the same year accounts for a more optimistic average of 27.
Although these values have been considerably affected by the pandemic – improving in 2021 with an average NPS score of 12 and 45, respectively – the airline industry has always struggled to secure its place on the NPS benchmarks. That was mainly due to poor customer experiences and low loyalty levels, which directly correlate with NPS.
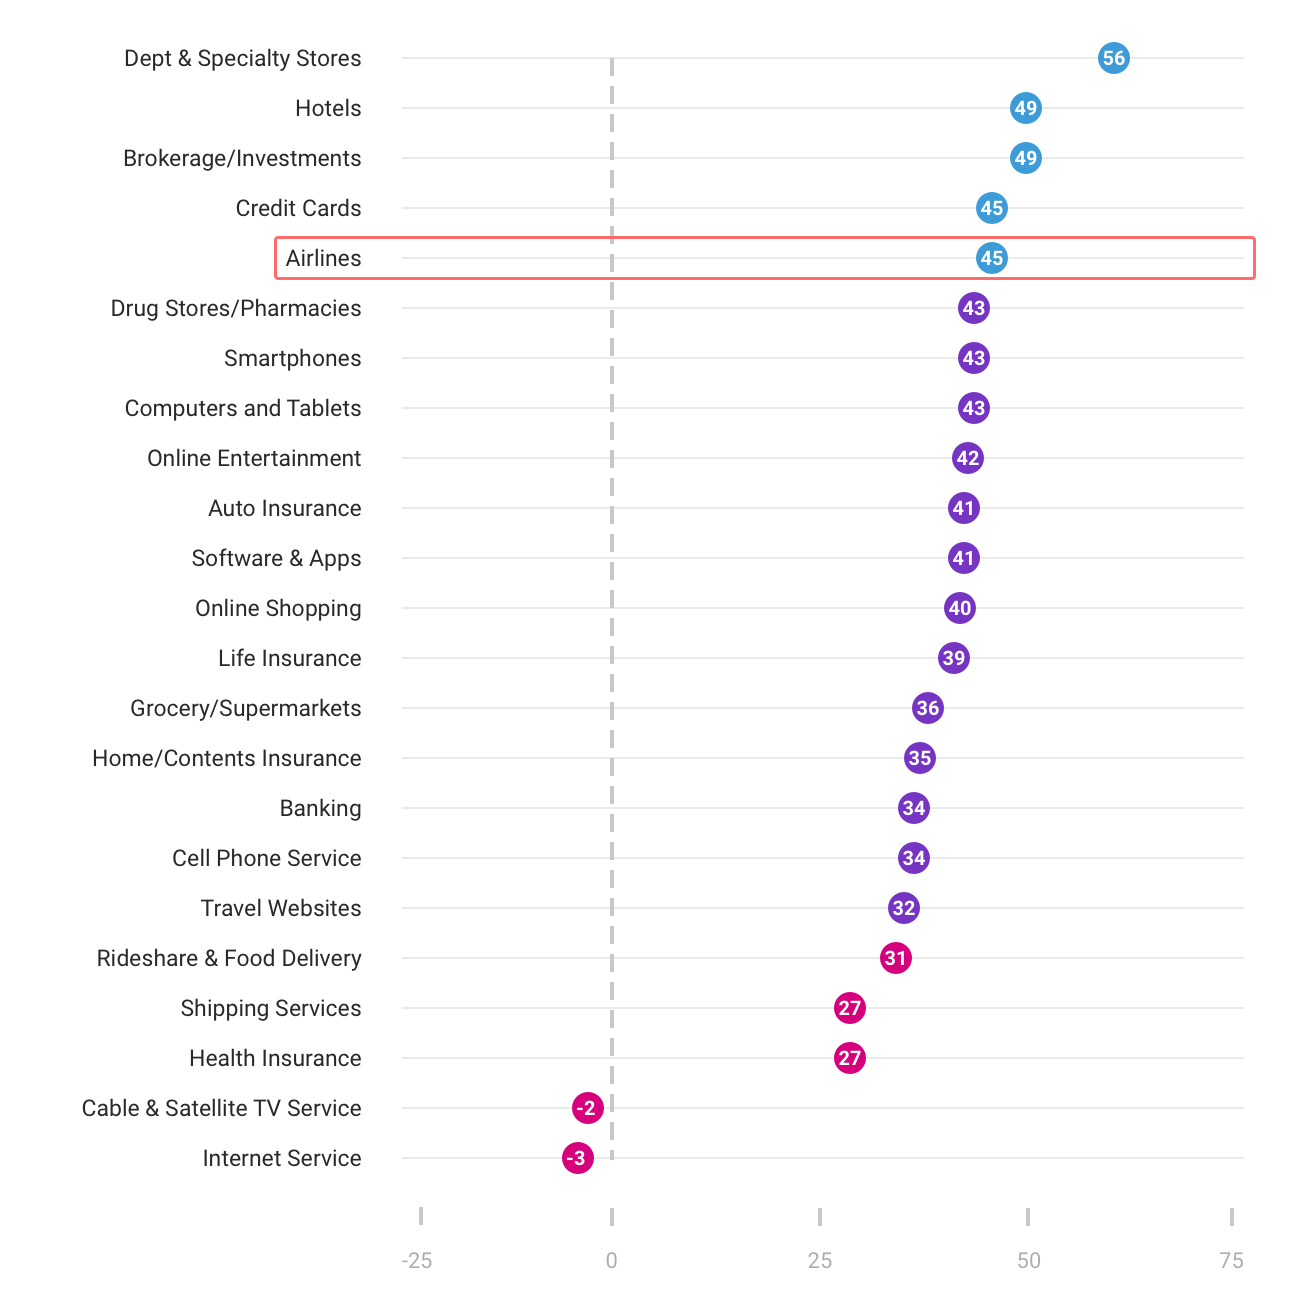
“Despite the uptick in metrics for customer service, aviation is still a sector, where customers have lots of issues when compared to other products or services that they consume on a regular basis,” said David VanAmburg, director of ACSI (American Customer Satisfaction Index). “From having a decent flight experience to getting to your destination without losing your luggage, every single element forms a critical part of the overall airline experience.”
And it’s not that airlines are oblivious to the underlying testimony. On average, the industry spends over $1.3 billion per month on engaging customers, boosting promotional offerings, and optimizing internal operations. Like other companies, airlines are also blitzing customers with customer satisfaction surveys the moment they step off the airplane.
But, despite all the efforts being made, the industry still falls behind in delighting customers and delivering favorable experiences. For instance, according to U.S. Department of Transportation’s Air Travel Consumer Report, in 2021 vs. 2019, there was a 225.84% jump in complaints received from consumers about airline services. Already in September 2022, the numbers went up to 380% compared to the pre-pandemic levels. Although the huge increase was mainly due to the pandemic and the many refund complaints the industry has been facing, earlier reports still accounted for regular increases in the value on a YOY basis.
While there can be several reasons for low customer satisfaction in this industry, there are four primary factors that skew the metrics for the sector:
Service Polarity: Traditionally, airlines have segregated their customer base into two segments — economy and business class. While business passengers continue to enjoy top-notch services, economy passengers are forced to squirm in 28 or 31 inches of legroom and be lucky enough just to get a pack of nuts and soda. The extreme polarity in customer service, backed by an exorbitant pricing structure, often agitates economy fliers, as they feel they are being mistreated.
Low Tolerance: Airline customers have extremely low tolerance towards any problems they face during the flight experience. That’s because customers pay considerably more for a flight ticket and take an enormous risk trusting the airlines with their personal safety and baggage. The high-risk investment increases the expectation levels and decreases the tolerance barriers.
Price Sensitivity: US airline customers (and nearly customers all over the world) have shown that there’s only one factor that matters the most while picking an airline – pricing. That has led to pricing wars in the airline industry, but in significantly cutting down costs, airlines have overlooked elements like the comfort and convenience of their customers, leading to higher customer dissatisfaction.
Poor Employee Satisfaction: It is a universal truth that happy employees provide better customer service. If anything goes wrong with booking, luggage, food, etc., well-trained staff will always be able to defuse the situation. Naturally, the resulting NPS will be higher as customers always appreciate friendliness and desire to help.
Airline Industry’s Response to the Pandemic
Since customer satisfaction is central to the Net Promoter System, airlines have to work hard to provide a seamless experience even during challenging times. The main concerns now involved ensuring passengers’ safety, decreasing face-to-face communication, and transitioning everything into an online experience.
Naturally, the attention of companies went from food and entertainment to health concerns. Airlines turned to scientists for advice, but also listened to their customers and took extra precautions to reduce travel anxiety. In addition to general safety rules, American Airlines introduced touchless check-in kiosks to avoid any contact. At the same time, United provided wipes to their passengers to clean their seats and make them feel safe, though flight attendants had already done it. United was also the first airline to provide the possibility to take rapid coronavirus tests at the airport.
Delta communicated with its passengers through surveys and found about their concerns with air quality, which is quite understandable as they have to spend hours in a confined space. Now their staff changes air filters more often than recommended by scientists. Due to rigorous procedures, Delta ranked first among the ten largest US airlines for the response to the pandemic.
Though it’s not an American carrier, Emirates went even further and offered to cover medical and quarantine expenses if passengers contract the virus while traveling.
Online operations have become more important because of social distancing rules and sanitation concerns. While some passengers prefer to check in at the airport, now it is almost a must for every airline to have a mobile app that allows them to do it without physically communicating with staff. That’s especially relevant in the times when carriers cut jobs. For example, United announced in 2020 that they would let 13,000 employees go while hoping to get government aid; while in 2021, they informed that the jobs of 14,000 employees were at risk when the second round of federal assistance expired.
Competitive NPS Analysis in the Industry
Despite being in a highly challenging industry, some airlines have managed to stay profitable and delight their customers on a consistent basis. For instance, Southwest was ranked #10 in the Customer Service Hall of Fame, with their customer relationship model becoming a case study in delivering great customer service. The company also recorded the highest NPS score in the airline industry in 2019 and 2020.
Southwest is the first airline to introduce profit sharing to encourage its staff to work harder. Since their well-being is tied to the company’s success, employees are motivated to go above and beyond in performing duties.
Delta is another airline that adopted the profit-sharing model. At the beginning of 2020, the management distributed a record $1.6 billion among its 90,000 employees. It sure works, as Delta is frequently ranked high in many areas of flight operations: in 2019, The Wall Street Journal named it the best airline.
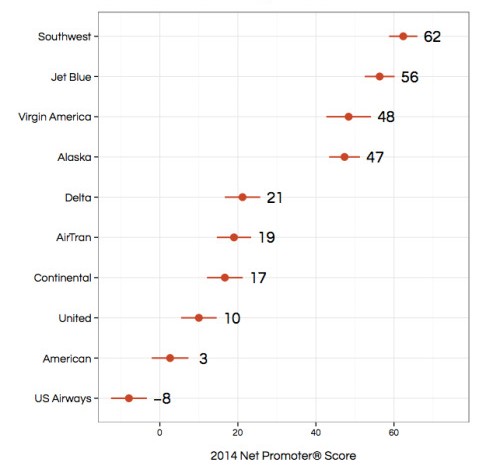
Alaska Airlines was ranked #1 in Satmetrix NICE NPS Benchmarks Survey of U.S Airlines, 2021, while other airlines struggled to stay competitive. For instance, despite flying over 104 million passengers and clocking $24,6 billion in revenue, United has been right at the bottom of the list for years. In 2020, it also ranked #10 in the Customer Service Hall of Shame, registering the biggest number of complaints of any US carrier – 11 274, to be precise.
Over the years, the news about passengers being dragged because of overbooking became routine. For some time, flight attendants complained about understaffing. In addition, the airline management replaced quarterly bonuses with a lottery-based system. Naturally, employees are not incentivized to work hard and please passengers.
In 2008, musician Dave Carroll’s frustrating experience with United Airlines became a well-known example of customer feedback shaping a company’s reputation. Carroll, a member of the band Sons of Maxwell, had a $3,500 guitar damaged during a United Airlines flight. Frustrated by the airline’s indifference and lack of compensation, he wrote and recorded a song – “United Breaks Guitars”. The song (which later became part of a trilogy) went viral, significantly impacting United Airlines’ reputation and customer satisfaction. Fast forward to 2017, the hashtag #unitedbreaksguitars trended on Twitter after another controversial incident where United Airlines forced a passenger out of the plane to accommodate crew members needed elsewhere.
Recently, United recorded some decent attempts at improving customer service. A good example is how the company handled the challenging trip of Jason Dorn. He posted about his experience on social networks, prompting many reactions and positive word-of-mouth for United Airlines.
In 2021, United Airlines, which has been lagging in terms of customer service for many years, declared it had shifted focus to Net Promoter Score to evaluate how it is performing compared to other carriers. That will certainly have a direct effect on both their customers and employees, but until then, let’s focus on available data.
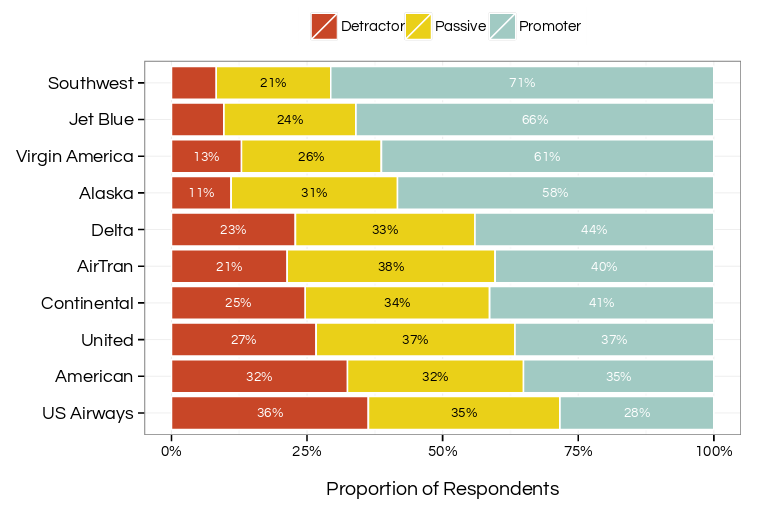
While the comparison of NPS scores provide a bird’s eye view, the overall customer dissatisfaction is quite apparent in the breakdown of airlines’ NPS. For instance, while Southwest has only 8% Detractors, United has 37% Detractors (despite having a higher NPS than U.S Airways).
To ensure relevancy, we also looked into late 2022 data; however, the picture did not improve considerably over the years.
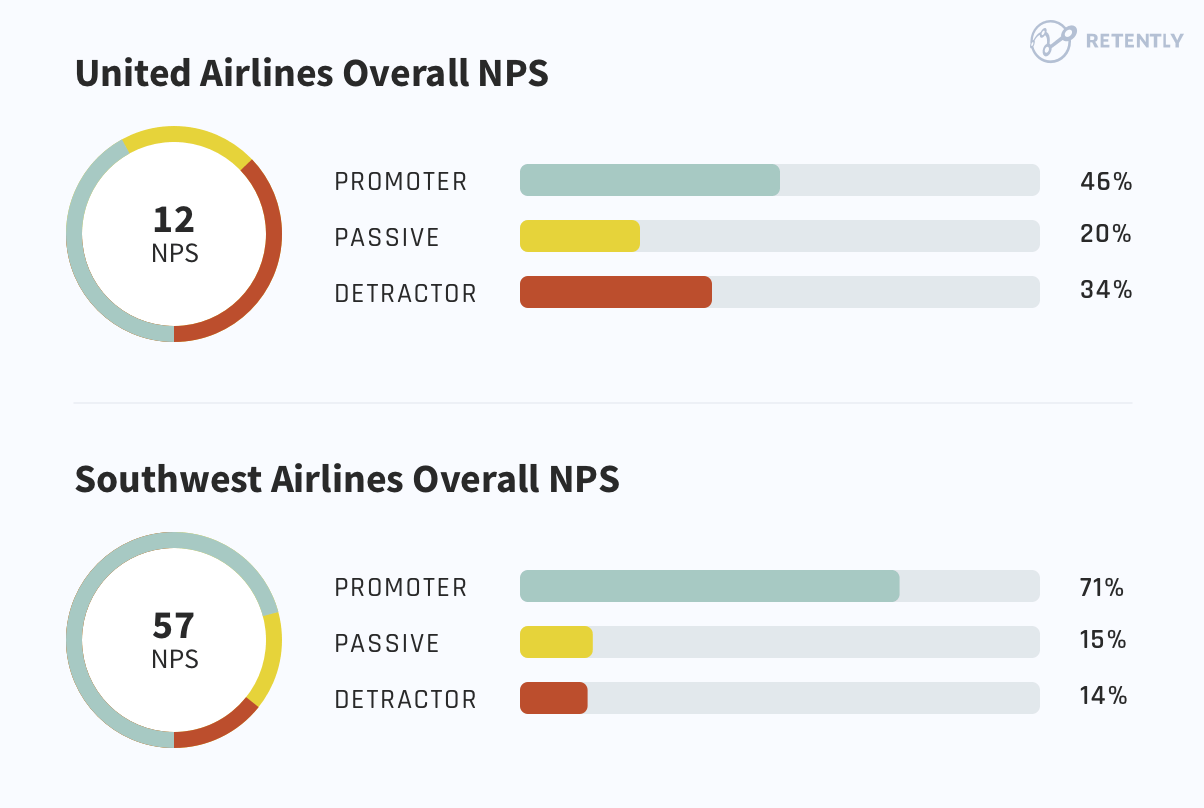
The numbers might seem insignificant from an operational perspective, but a closer look at the bottom-line margins and the amount of carried passengers help us assess the impact of delighting customers. For instance, here’s a look at the top five airlines by passenger traffic:

And here’s a trend analysis of the bottom-line margins of the airline industry from 2008-2013:
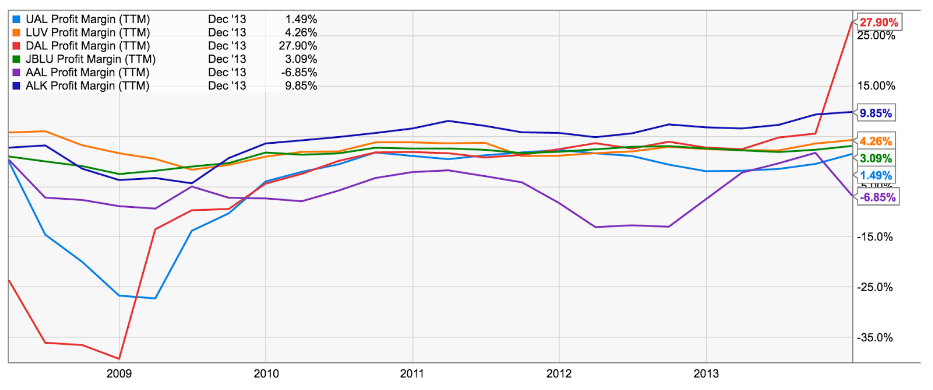
As you can see, Delta (DAL) managed to sustain the highest profit margins, while companies like United (UAL) and American Airlines (AAL) had the lowest profit margins, despite flying more customers than their competitors.
While it’s certainly fascinating to establish a direct correlation between customer satisfaction and profitability, that’s not the goal of the NPS study. Just like how NPS insights matter more than the number itself, the strategies that these airlines used to improve customer satisfaction are more important than the technical analysis.
For instance, what different strategies did Southwest use to improve customer satisfaction? How did they capture the voice of the customers? How did they prioritize their operational goals? And how did they measure the financial impact of corrective action?
Intending to understand the factors that drive customer loyalty in the airline industry, Satmetrix published a report on the US Airline industry, in which they outlined a framework that could gauge customer’s relationship with a brand (relationship drivers), and assess customer satisfaction with specific aspects of a product or service within the vertical (industry drivers).
The study leveraged the power of open-ended feedback and individual Net Promoter score to assess the importance of each driver in delivering customer satisfaction. While crunching down the whole study is beyond the scope of the post, we have extracted the core data analytics strategy to help you understand how airlines use NPS data to boost profits and improve customer satisfaction.
Importance v/s Performance: Classifying the Bottlenecks
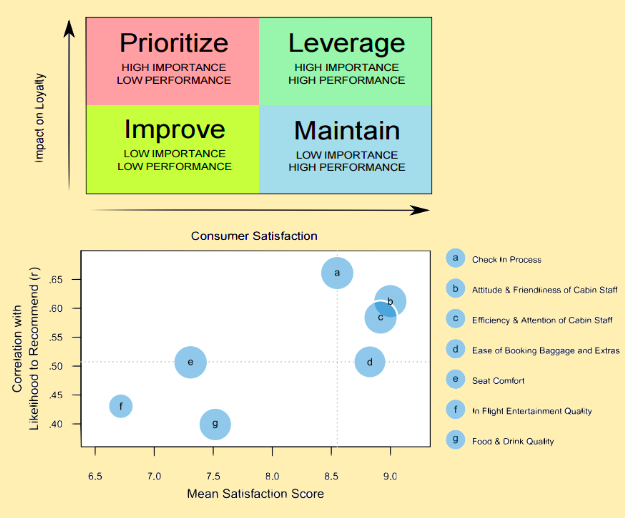
Compared to other businesses, running an airline is an operational challenge, because many pieces in the system need to function flawlessly to deliver a delightful flight experience. But again, identifying the bottlenecks is not enough; classifying them based on their importance is.
For instance, United found that just improving the coffee made customers happier, while American Airlines teamed up with local logistics players to deliver baggage directly to their place, allowing customers to skip the queue. However, despite their proactive efforts, both these airlines find their place at the bottom of the list.
That’s the reason why the importance-performance model is so important.
It allows companies to classify bottlenecks and understand the business impact of strategic decisions. By mapping their strategies with customer emotions, a brand can eliminate all guesswork and get a clear perspective of what matters the most.
Here’s how it works:
-
- Identification: First, the industry and relationship drivers for the industry are identified. For example, industry drivers for aviation are more specific, like, staff attitude, seat comfort, flight entertainment, etc. On the other hand, relationship drivers are more generic, like, the reliability of services, value for money, online experience, etc.
- Classification: Once the drivers are identified, they are mapped against the mean satisfaction score and the relative increase in LTR score. So, if we had to plot a driver on the graph, we would have to consider the mean satisfaction score for that driver and the likely impact on LTR. For instance, based on the above graph, Southwest has a poor satisfaction score (6.6) for in-flight entertainment, but since the impact on the LTR score for the driver is low (0.42), improving the quality of service won’t have a drastic impact on customer satisfaction. On the other hand, drivers like staff attitude and check-in process have a high LTR score and mean satisfaction score, which means the airline needs to maintain its focus on these drivers, as they are important.
- Plotting: It’s clear from the graph that a relative increase in LTR measures the importance of the driver, while a relative increase in the mean satisfaction score measures the impact or performance of the driver in the industry. To make the assessment simpler, the study divides the plot into four equal quadrants by taking the midpoints of importance and performance metrics.
- Interpretation: Once the quadrants have been plotted, it becomes simple to understand which factors are pivotal to customer satisfaction. For instance, drivers that fall in the “high importance, low performance” section should be prioritized, as they deliver maximum impact on the LTR score and are one of the top reasons for customer dissatisfaction. Similarly, drivers in the “high performance, high importance” quadrant should be leveraged effectively, as these are the reasons that matter the most to the customer and make them happy with the business.
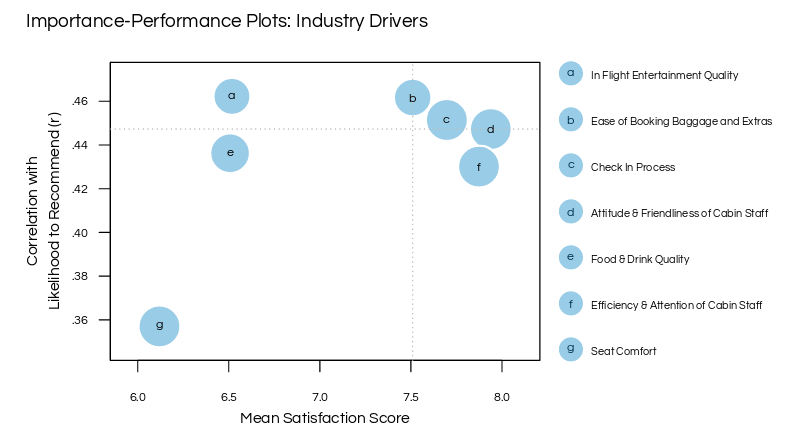
Lastly, the size of the bubble (as shown in the above graph) is determined by the percentage of customers that gave opinions on the driver, which means the larger the bubble, the greater the impact of the strategic change.
Now, using the theory as a reference, we will compare the best airlines on the survey – Southwest (highest percentage of Promoters) with the worst airline – United (highest percentage of Detractors). The analysis will help us break down the major reasons for customer dissatisfaction and analyze the key areas of improvement for each airline.
Southwest vs. United: What Separates the Best from the Worst
For plotting the competitive performance graph, the NPS framework was broken down into elemental blocks, so that the importance of each driver could be accurately gauged. While the gray horizontal scale spans the industry average, the blue dot indicates the score of the airline on that scale.
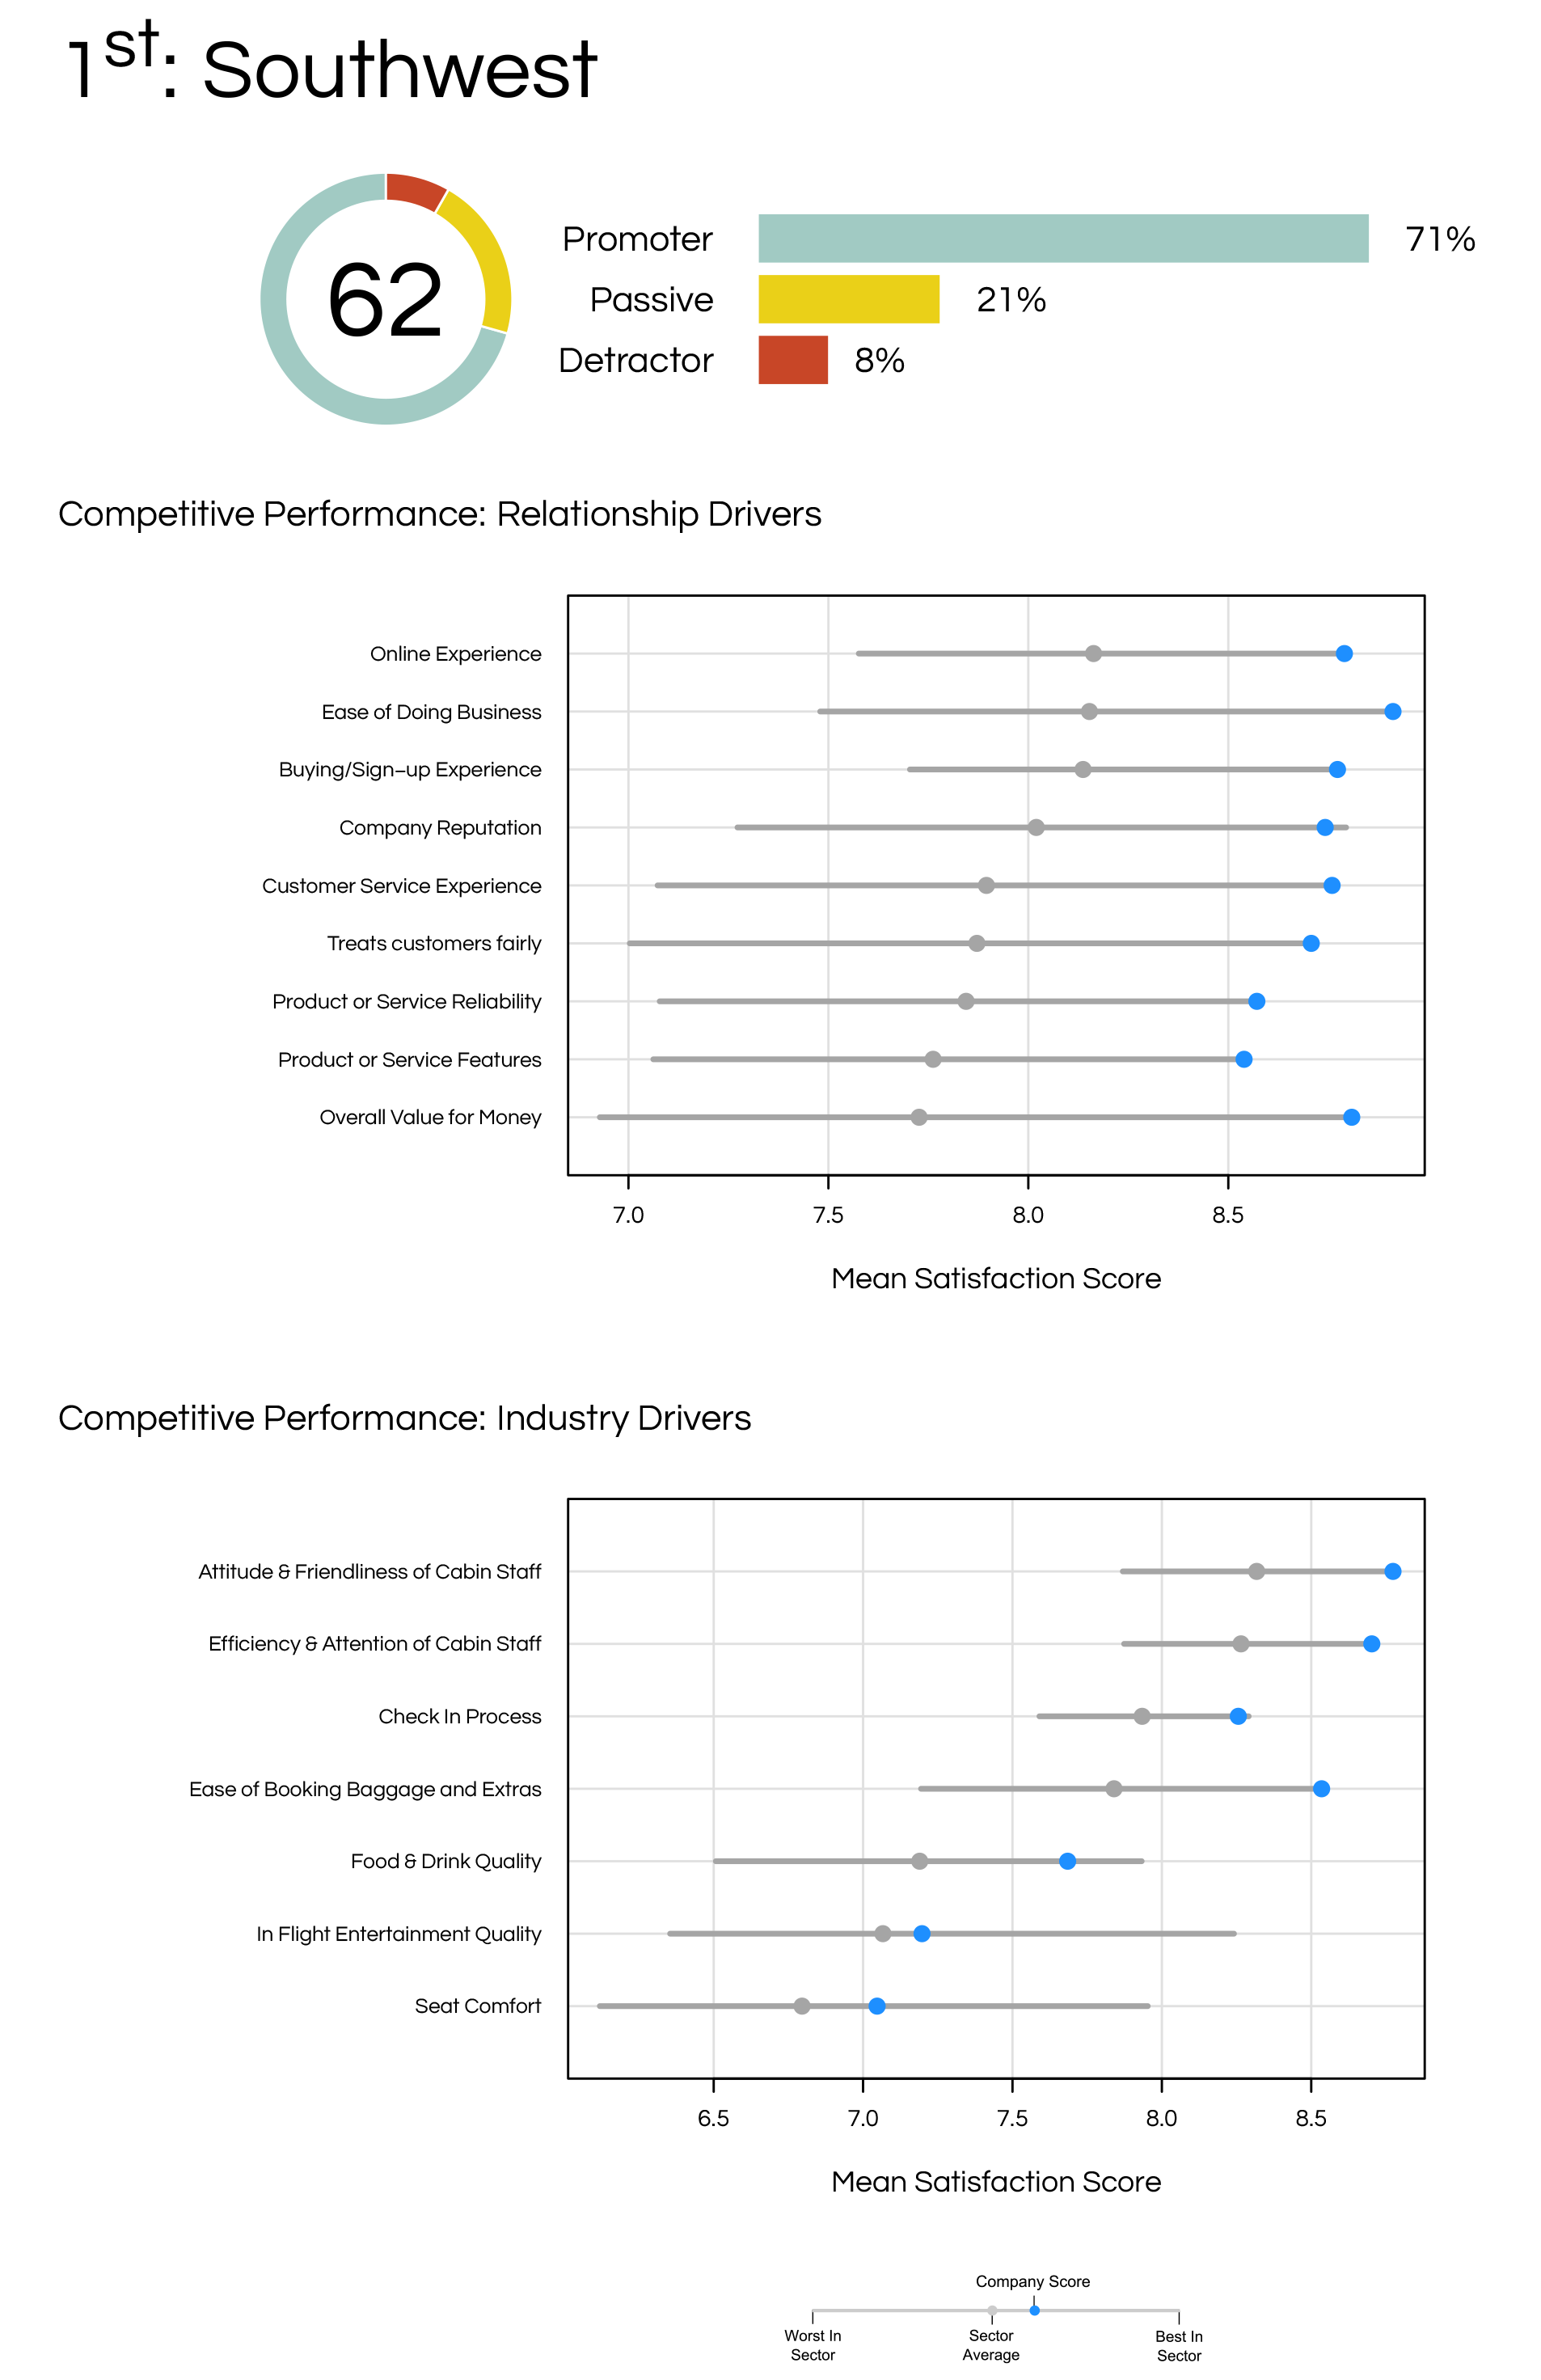
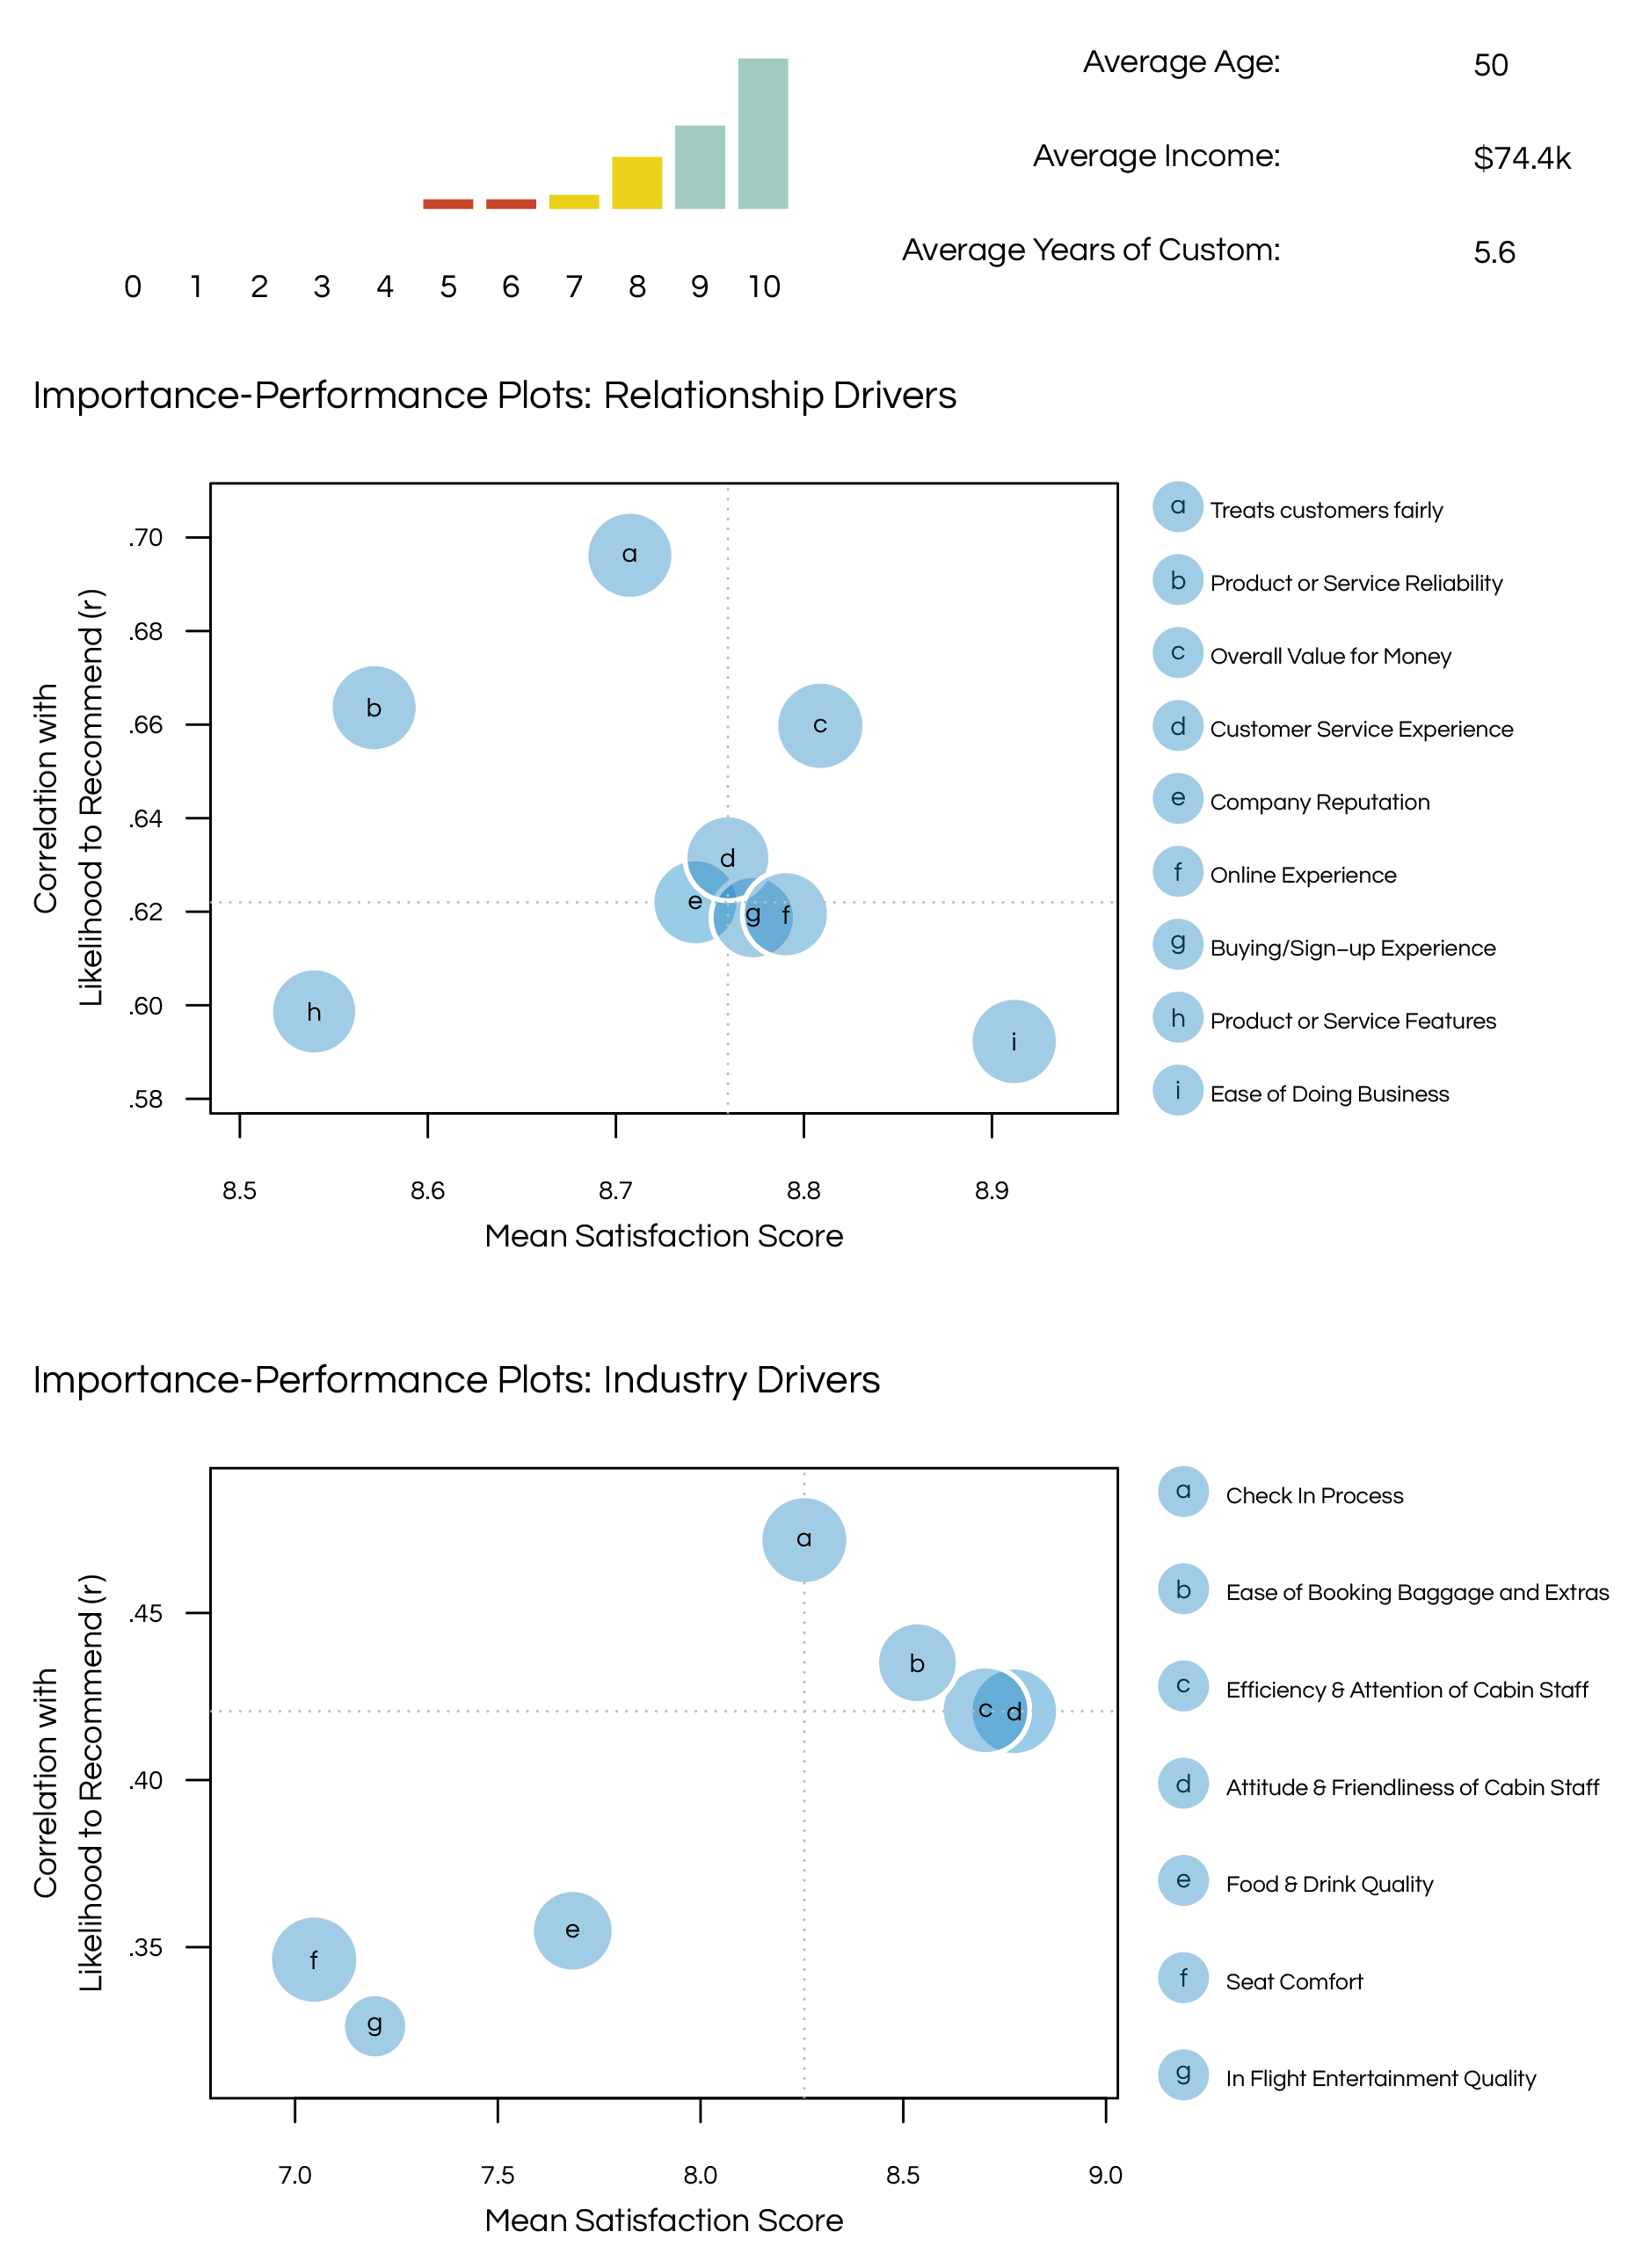
As you can make out from the comparison, Southwest leads the sector in almost every industry and relationship driver, except a few, like seat comfort or in-flight entertainment. However, a quick look at the importance-performance graph tells us that improving seat comfort or in-flight entertainment would have a negligible impact on overall customer satisfaction.
On the other hand, United scores low on almost every driver, right from staff friendliness to brand reputation. So, how does it identify which areas need the most attention? If we have a look at the importance-performance graph for United, it becomes simple to understand which drivers need to be prioritized.
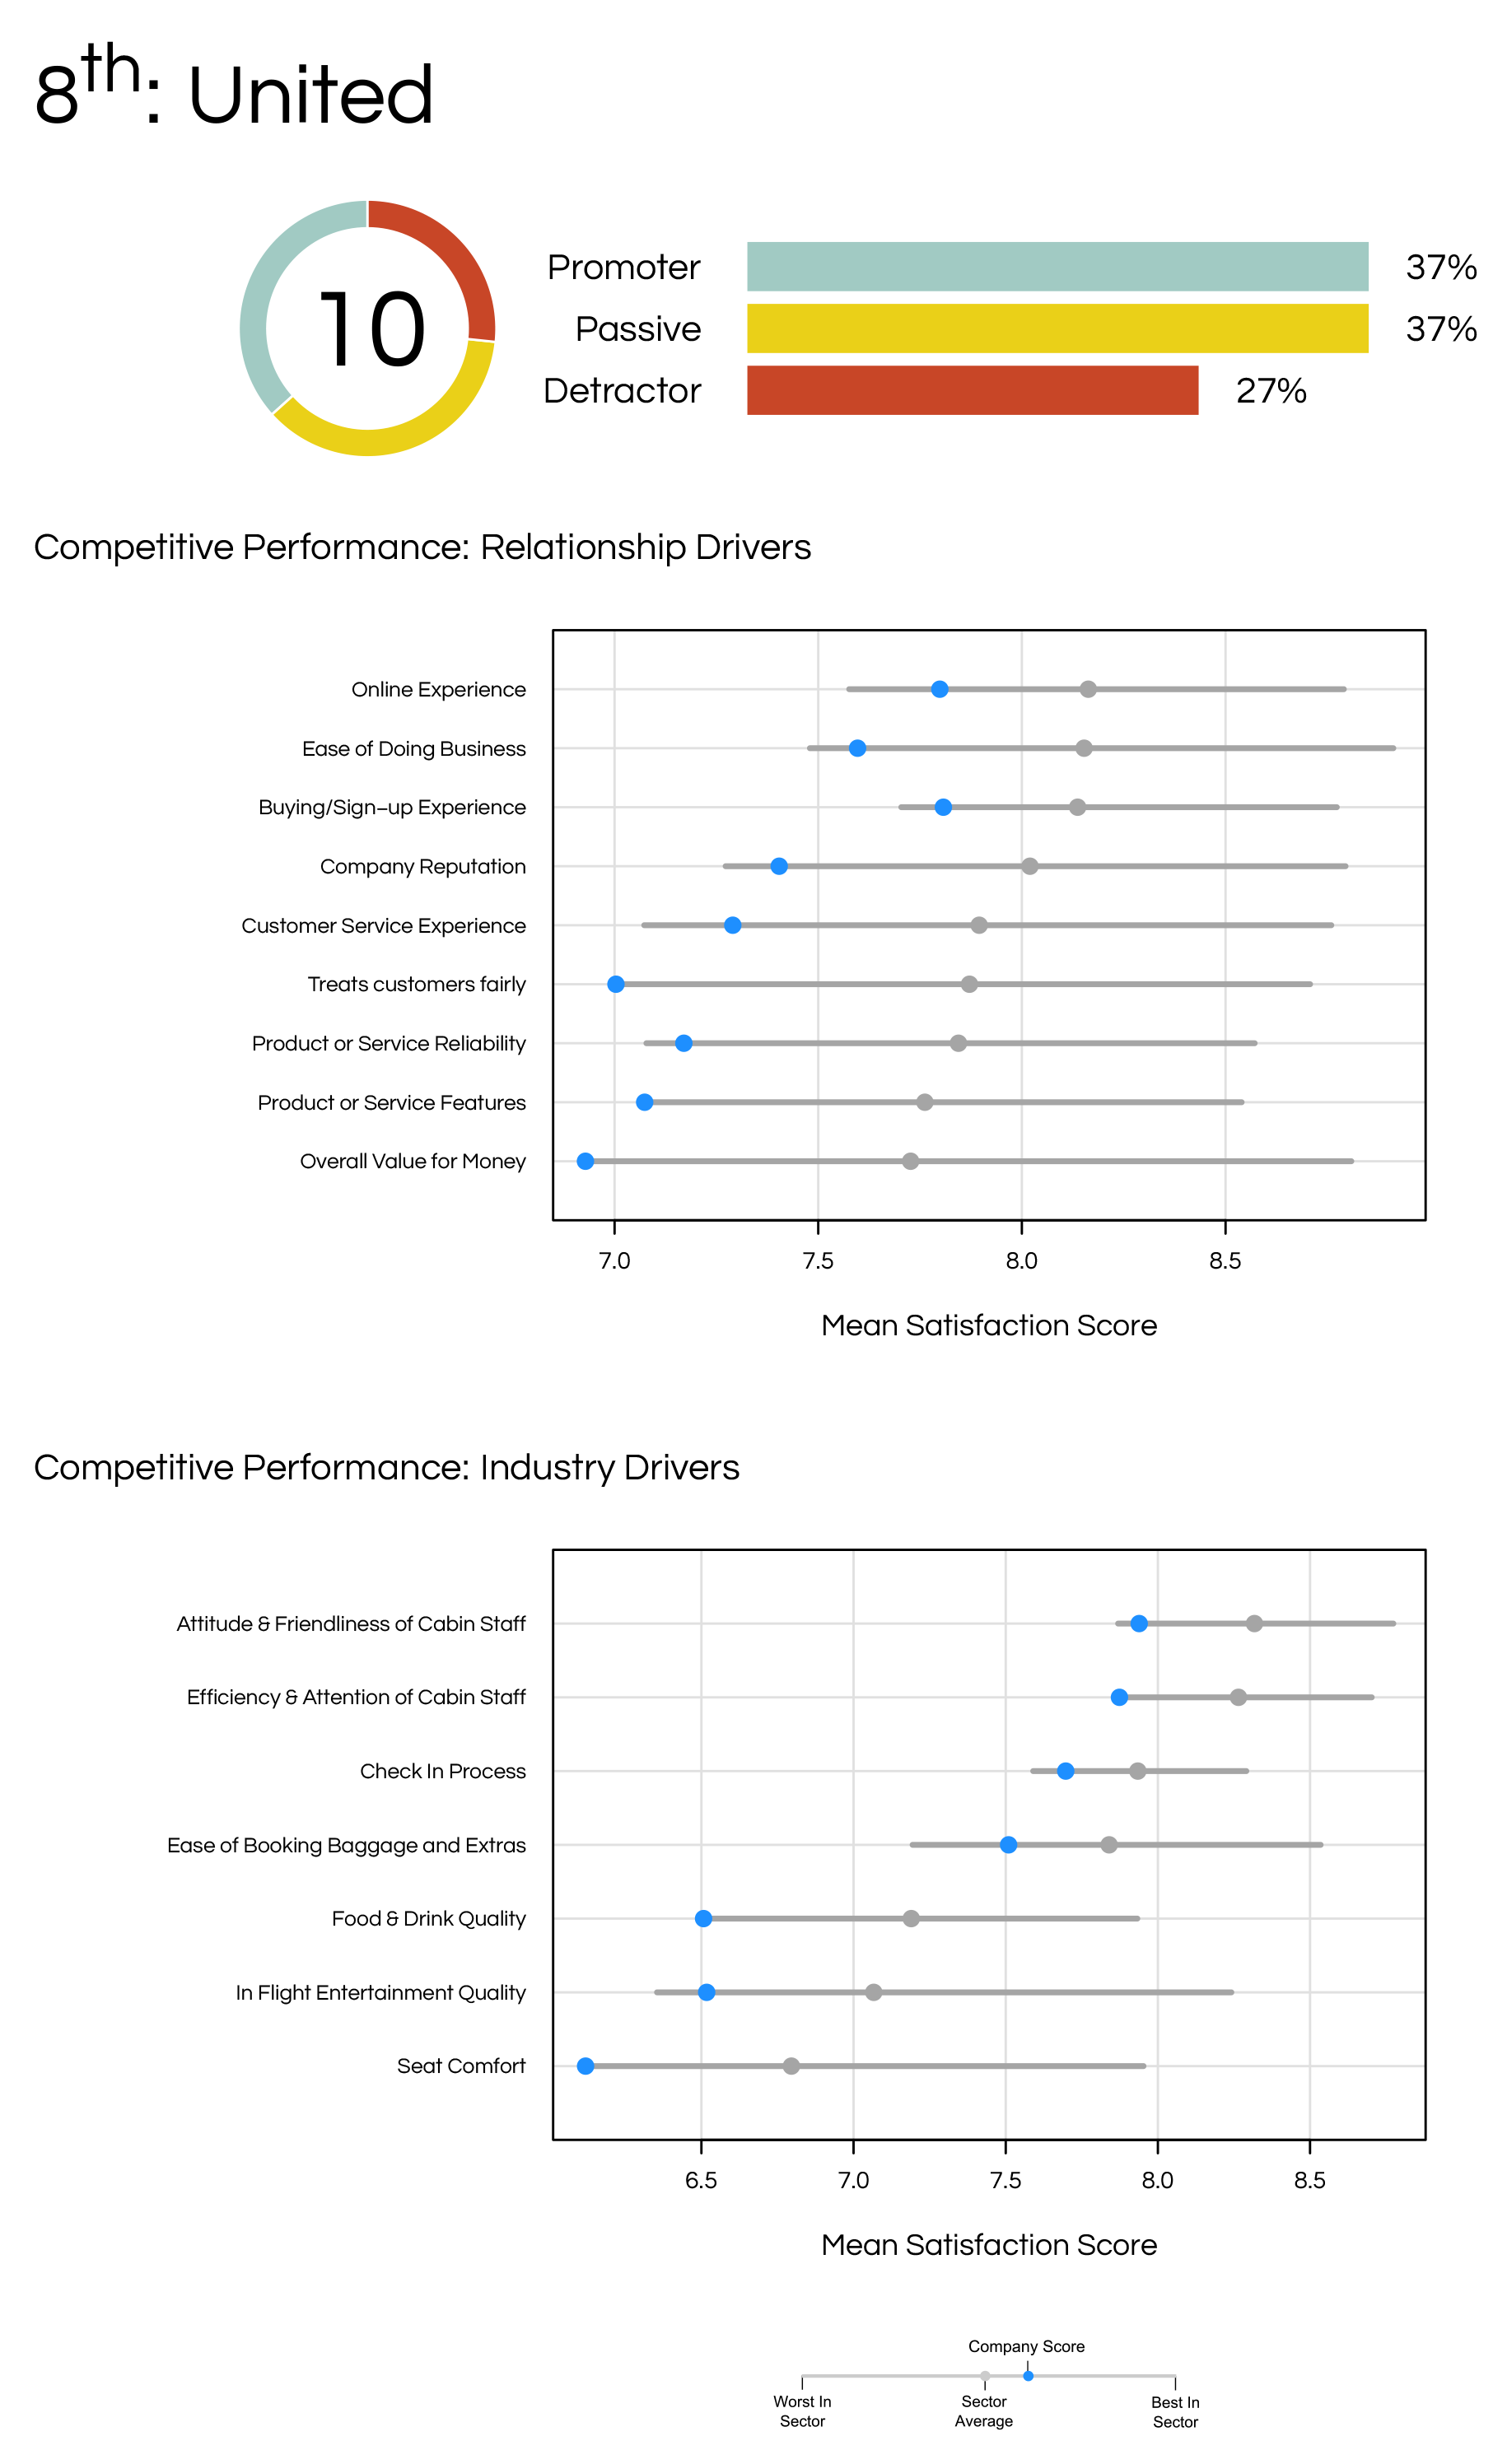
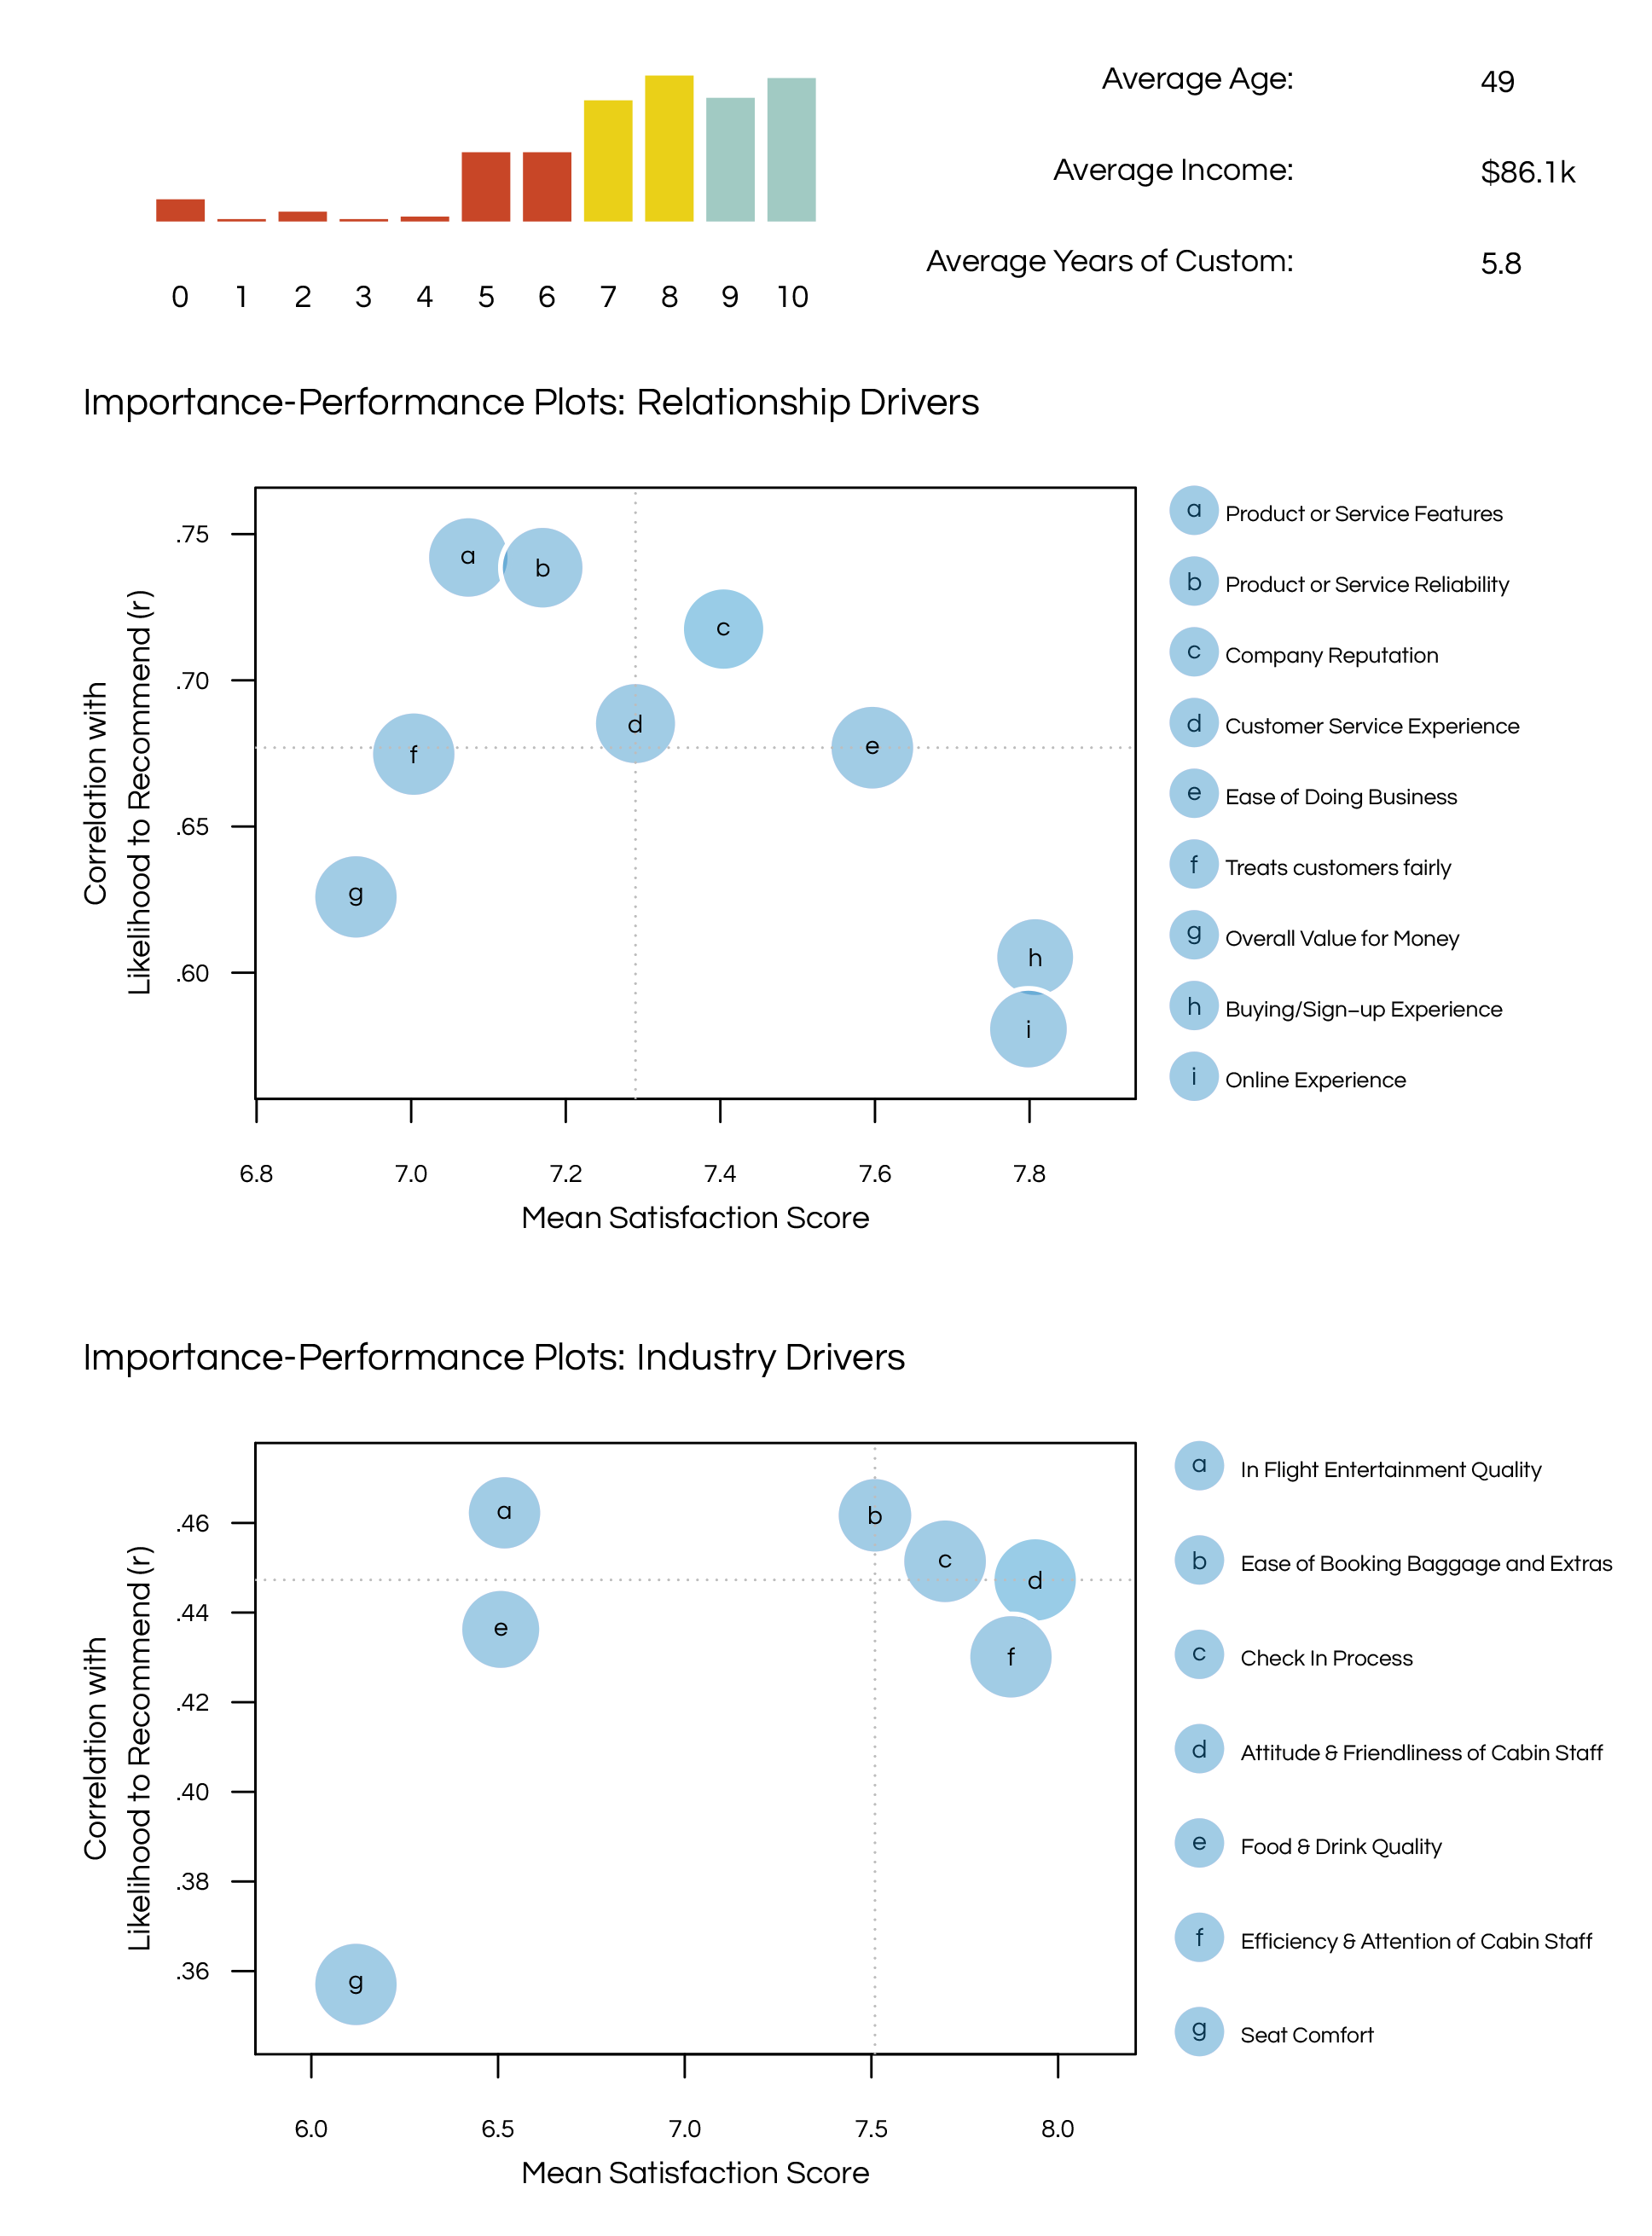
For instance, improving product features, the reliability of services, or in-flight entertainment quality would have a major impact on customer satisfaction, which was probably not the case with Southwest.
That might make you wonder: how can flight entertainment matter a lot to United customers while being largely insignificant to Southwest customers?
That’s because Southwest operates on a low-cost model, focusing more on the factor that matters the most to customers — pricing, while United charges a higher ticket fare from customers, thereby increasing their expectations from the airline.
Improving Customer Experiences: The Road to Profitability
“You can either win with the best product, best price or the best experience.”– Sam Altman
Plotting the importance-performance graph using NPS data can measure the impact of a business decision on customer satisfaction and gauge the differential competitive edge. It’s a great starting point for airlines that want to improve their customer service and profit margins, but don’t know how and where to start.
Takeaways from the study
- Plotting the NPS score on the importance-performance graph helps businesses discover hidden bottlenecks and improve the overall customer experience.
- NPS provides a data-driven methodology to prioritize customer issues and gauge their ROI on the top-line, eliminating all internal “guesswork”.
- Segmenting NPS feedback with regard to industry drivers can be pivotal in measuring competitive differentiation within the industry, while plotting the score with regard to relationship drivers helps businesses in gauging overall customer satisfaction.
- Even within the same industry, customers can have different expectations from different brands, based on the product pricing and offering.
- Great customer service and profitability can go hand-in-hand when you have a framework to proactively listen, act and reflect on customer feedback.
Measure Your Net Promoter Score
The Net Promoter Score is undoubtedly reaching maturity since more and more companies across industries use the metric to understand how people feel about the brand, as well as measure customer satisfaction and loyalty.
Retently makes it easy to measure the NPS score of your brand. With quick installation and easy-to-follow documentation, you can get actionable insights on how to reduce customer churn, grow revenue, and build long-term customer satisfaction.
Easily import your customers and keep their data in sync using our built-in integrations with MailChimp, ConstantContact, Zapier, etc., or use Retently’s extended API to connect your account with any other service. Create a free account now to try many other features and start gathering customer feedback.




 Greg Raileanu

 Alex Bitca


 Christina Sol