Table of Contents
Most companies focus on continuously improving their customer satisfaction, and tracking Net Promoter Score is an important step in building a culture of Customer Success. Over the years, Net Promoter Score has proven to be a key customer satisfaction metric. But here’s the thing: while NPS can give you a quick snapshot, focusing only on the score can sometimes make you miss the bigger picture.
This article will explore why the volatility of NPS can lead to frustration and why closing the feedback loop and addressing the issues your customers report can have a much greater impact on your business than just aiming for a high NPS.
Key Takeaways
- Reliable NPS results consider factors like population size, response rate and margin of error, all while keeping the survey process manageable.
- Engaged, long-term customers provide more actionable insights into customer satisfaction and service consistency.
- Acting on customer feedback leads to more significant business outcomes than getting a statistically significant NPS survey result.
Net Promoter Score Volatility and Frustration
The benefits of NPS are clear: it provides an easy-to-understand metric that can be tracked over time, helping businesses identify trends and make data-driven decisions. However, if you’re only tracking the score for the sake of it, you are wasting time and effort.
The score itself is highly volatile, causing frustration within the Customer Success department. Because NPS scores can fluctuate due to various factors – such as individual customer interactions, seasonality, or changes in sample size – it can be difficult to get a consistent read on customer sentiment.
This volatility can lead to several issues. For one, the greater the shake we see in the score, the more instability it causes within the Customer Success team. They are responsible for monitoring and improving NPS, and when scores fluctuate wildly, it can be challenging to pinpoint the exact causes and take corrective action. This uncertainty can lead to stress and frustration among team members, who may feel like they are constantly chasing a moving target.
Having to explain to management a considerable increase or decrease in the score is an unpleasant task at best. It generates possible windy discussions and at worst, may undermine the credibility and the entire effort of the Customer Success team. The volatility of NPS means that even small sample sizes or a few negative interactions can skew the results, making it hard to present a clear and accurate picture of overall customer satisfaction.
Furthermore, management may become skeptical of NPS as a reliable metric, questioning its validity and usefulness. This skepticism can further complicate efforts to improve customer satisfaction, as the team may struggle to gain support and resources for their initiatives.
Let’s explore the science behind NPS volatility and discuss how to ensure your NPS surveys are statistically significant, providing a more accurate and reliable measure of customer satisfaction.
The Science Behind Net Promoter Score Volatility
While Net Promoter Score is a metric that quantifies your customer satisfaction, there is no absolute number of clients you should interview during your customer satisfaction survey to get a statistically significant NPS. That number depends on several factors and differs from business to business. For some B2B companies, getting 50 NPS survey responses might be significant, while some B2C companies would need at least a few thousand responses just to consider the results statistically reasonable.
If you only have 50 clients, getting 50 responses would mean 100%, and there is no chance you can have a sample of 100, 200, or 500 customers. At the same time, if you have 1,000 clients, getting 50 responses would only mean 5%, so it is hardly the same significance.
Several factors need to be taken into account for a statistically significant Net Promoter survey: population size, response rate, margin of error, confidence level and standard of deviation. Let’s get into some detail:
Population size
It refers to the total number of customers who can take the survey. Larger populations generally provide more stable and reliable NPS scores because they are less affected by the opinions of a few individuals.
Response rate
This is the percentage of customers who actually complete the survey out of those invited. Higher response rates improve the reliability of the NPS by providing a more representative sample of your customer base.
Margin of error
The margin of error reflects the accuracy of results, giving a range that the true answer is likely to fall within. A smaller margin of error equals more precise results, but achieving this requires a larger sample size.
Confidence level
It indicates the probability (usually expressed as a percentage) that the population parameter would fall within the margin of error. For example, a 95% confidence level means that if the survey were conducted 100 times, 95 of those times the results would fall within the specified margin of error.
Standard of deviation
This factor measures how much the survey responses vary from the average, showing if responses are similar or widely different. For instance, if the responses are spread out widely from the average, the standard deviation will be high, making the NPS less stable.
Check this article for additional information on how to calculate this.
Quantitative Analysis of NPS Precision
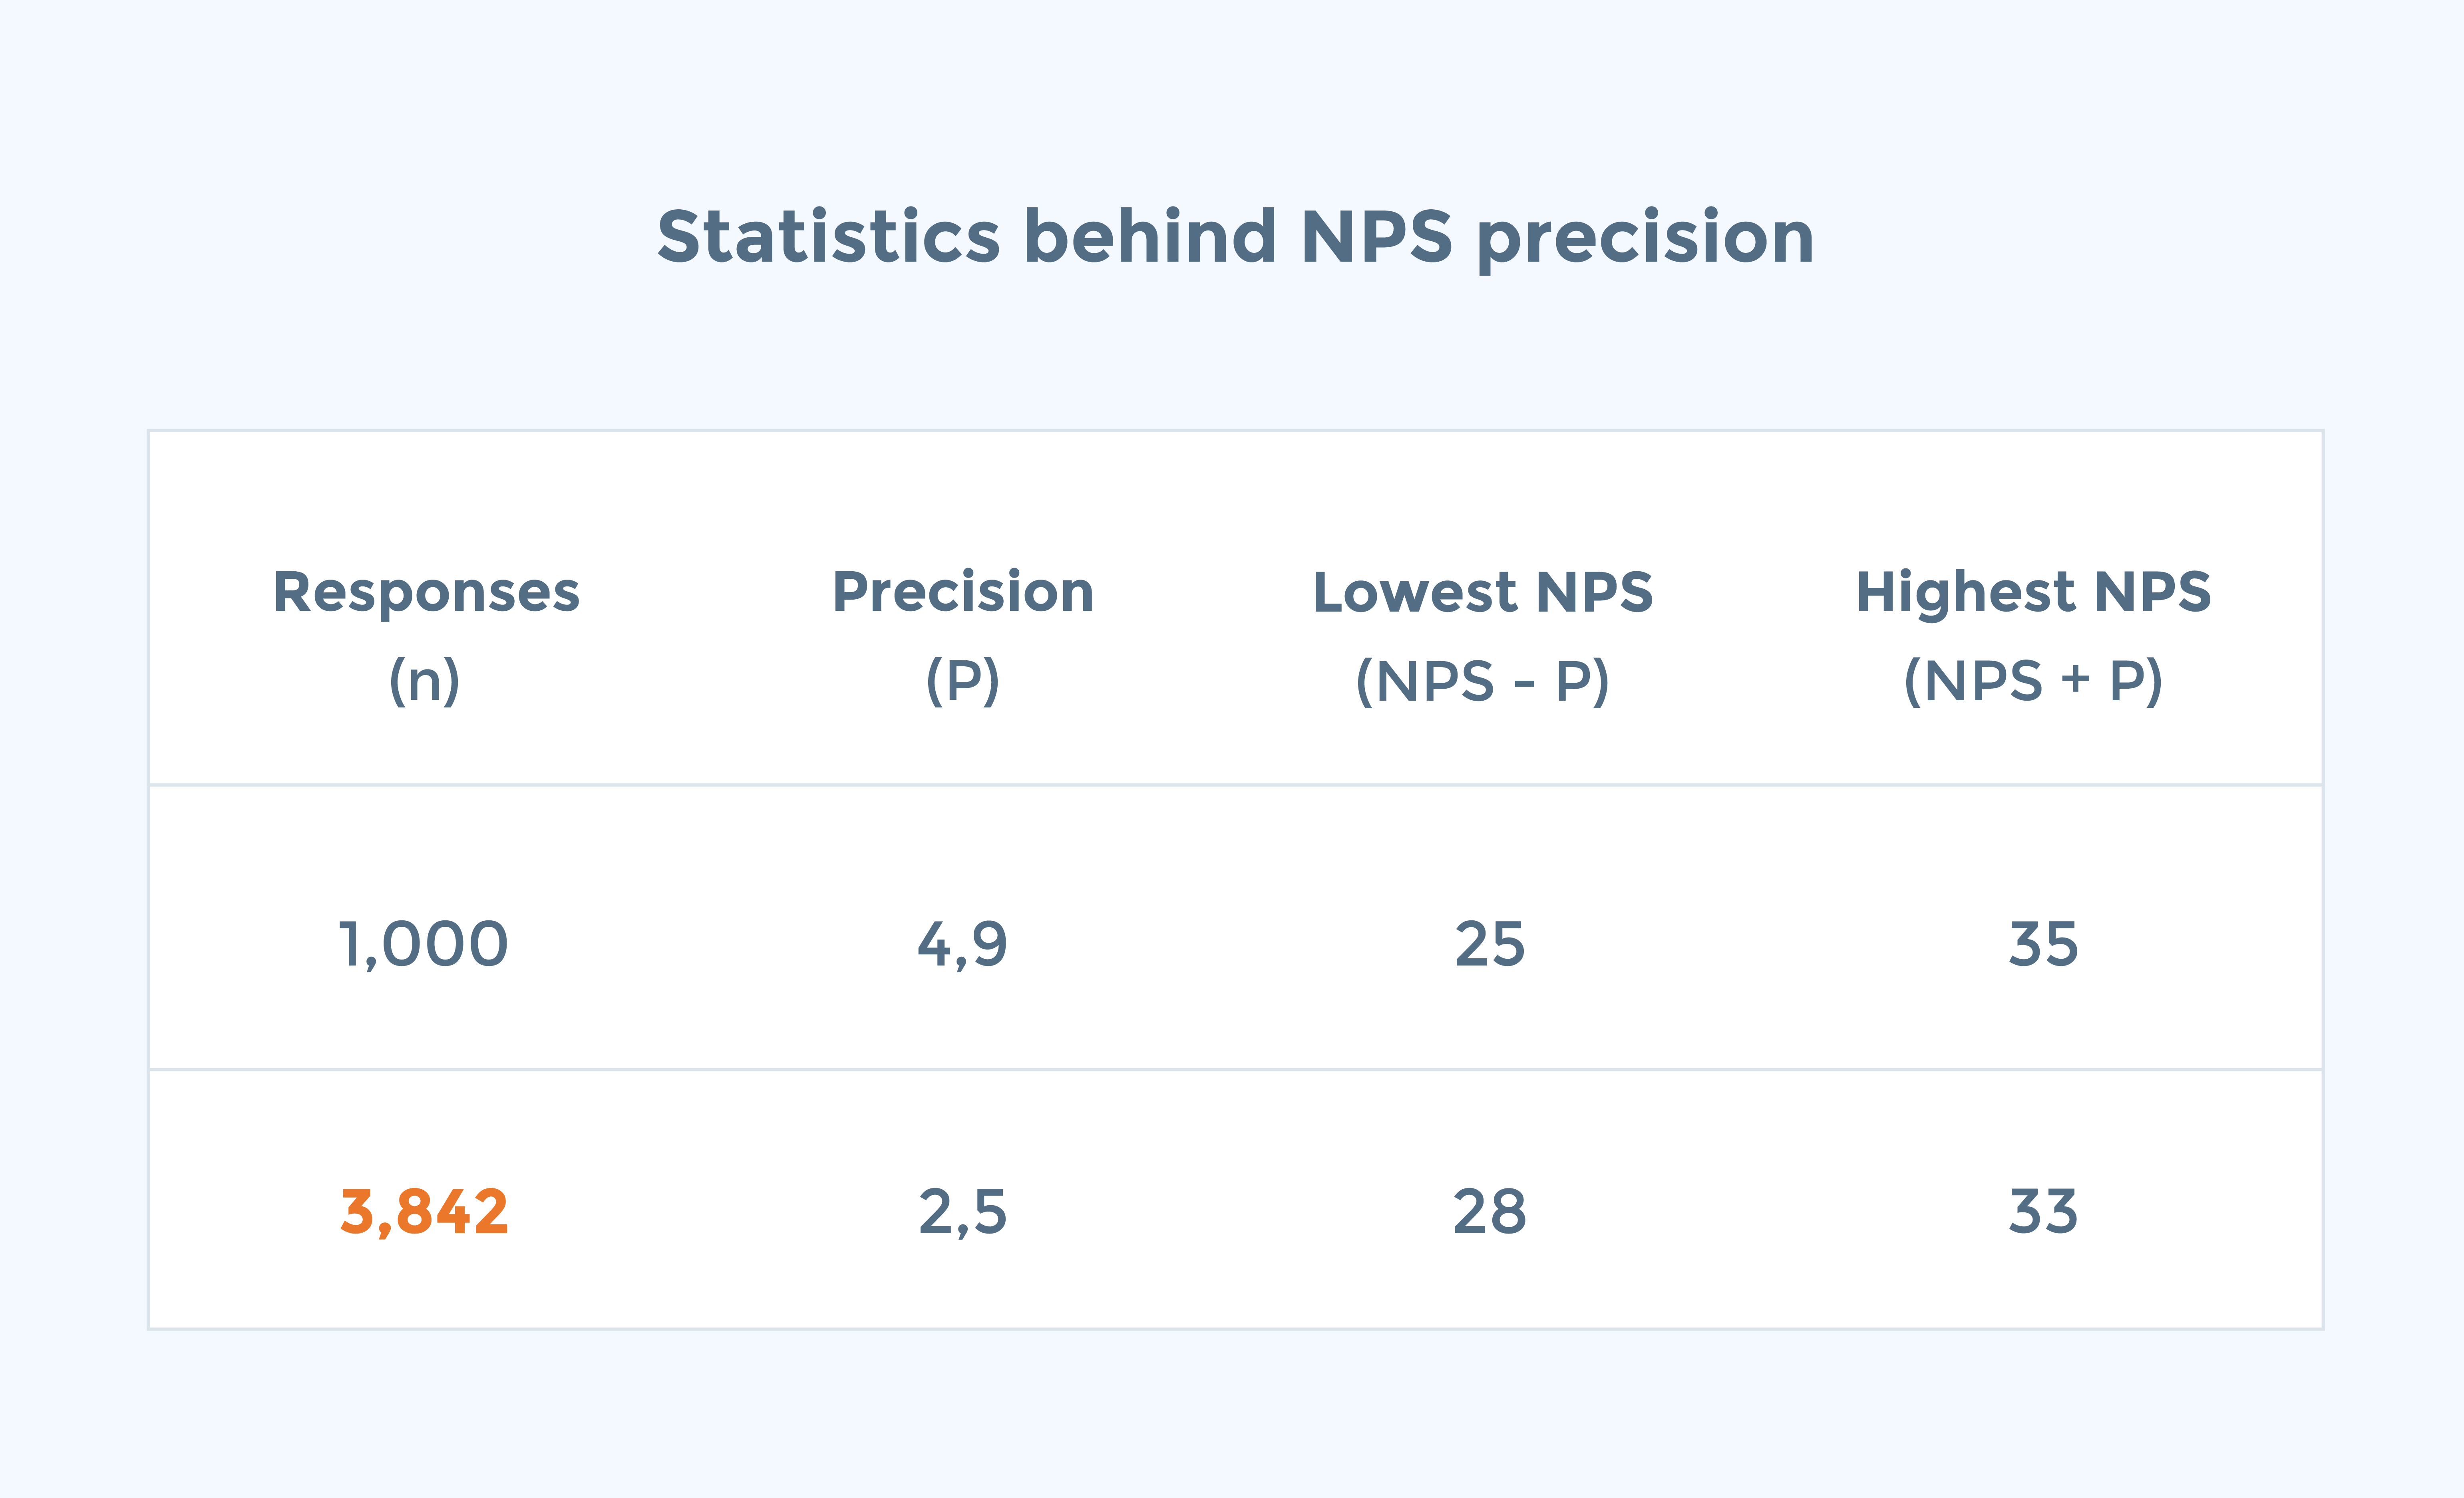
Let’s consider an example of an average to an above-average company with the following characteristics: 50% Promoters, 30% Passives, and 20% Detractors. The population size is 5,000 and with a response rate of 20%, the number of respondents is n=1,000. Thus, the NPS score would be 30 (50% – 20%).
In this scenario, the margin of error (MoE) for this score is +/- 2.5. It means that if we repeated this study 100 times under the same conditions, about 95% of the time, we’d expect to end up with an NPS rank between 25 and 35.

To increase the precision of this NPS campaign twice, we’d actually need a base size of over 3.8 as many respondents!
n * (P1/P2)2 = 1,000 * (4.9/2.5)2 = 1000 * 3.8416 = 3,842
(where P1 and P2 is the Precision factor)
In a typical 14% response ratio scenario, we would need x 27 more customers (3.8 / 0.14 = 27).
This agrees with the statistician’s rule that if we want to cut precision or margin of error in half, we must quadruple our sample size!
However, achieving such high response rates and large sample sizes can be challenging, especially for businesses with smaller customer bases. This is why it’s essential to balance the desire for statistical significance with practical considerations, like the cost and feasibility of collecting extensive survey data.
By understanding and managing the factors that contribute to NPS volatility, you can use this metric more effectively as part of a broader feedback strategy.
Choosing the Right Segment and Addressing Feedback
When it comes to gathering valuable insights from your NPS surveys, the quality of your sample is just as important as the quantity. This covers which customer segment you’re surveying, how long they’ve been your clients, how engaged they are with your product and service, and more. Here’s why:
- Not all customers are the same. Identify which segments of your customer base are the most valuable or have the most significant impact on your business. For instance, long-term customers, high-spending clients, or those who frequently engage with your products and services can provide more insightful feedback.
- Customers who regularly interact with your business are more likely to provide detailed and actionable feedback. Targeting engaged customers can help you understand what’s working well and what needs improvement. These are the customers who have experienced various aspects of your service and can offer comprehensive insights.
- The length of time a customer has been with your company can influence their feedback. Long-term customers may provide insights into your overall service consistency, while newer customers can offer fresh perspectives on the onboarding experience. By segmenting feedback, you can address both longstanding issues and first impressions.
Closing the feedback loop and addressing the issues reported by customers has a greater impact on a business than getting a statistically significant NPS survey result. Once you start receiving feedback, prioritize it and begin addressing the reported issues.
For this reason, it is recommended to start running Net Promoter Score surveys right away, even if you have just a few customers. This approach will embed customer satisfaction at the core of your company, making it a key part of the Customer Success culture.
Conclusion
NPS is a valuable tool that provides a quick snapshot of customer loyalty and satisfaction. However, relying solely on NPS can lead to volatility and frustration. To gain a comprehensive understanding of your customers, it’s important to integrate NPS into a broader feedback strategy. This includes combining NPS with other customer satisfaction metrics like Customer Satisfaction (CSAT) and Customer Effort Score (CES), as well as qualitative feedback from open-ended survey questions.
Improving customer satisfaction and loyalty requires more than just tracking metrics – it requires action. By prioritizing high-impact issues, involving cross-functional teams, and monitoring the effectiveness of your changes, you can ensure that your efforts lead to tangible results.
To fully realize the potential of your Net Promoter Score (NPS) strategy and see firsthand how Retently can transform your customer feedback into actionable insights, schedule a personalized demo. Explore how Retently’s tailored solutions can streamline your survey processes, provide deep analytical insights, and improve customer relationship management.


 Alex Bitca

 Greg Raileanu


 Christina Sol