Table of Contents
For every complaint you receive, there are approximately 26 customers who are unhappy with your company, but choose to say nothing. Those are the clients you will most likely lose if you don’t take proper action.
Besides just losing clients and revenue, low customer satisfaction levels can also harm your brand’s image – especially if certain customer complaints go viral online.
Luckily, customer satisfaction measurement tools can help you collect valuable customer feedback, so you can make the changes and improvements your customer base is actually asking for – all to offer them a better experience and a more pleasant customer journey.
For the sake of keeping things simple, we should mention that customer satisfaction metrics are generally also called CX metrics.
Key Takeaways
- No single metric can capture the full customer experience. Using NPS, CSAT, and CES together ensures a well-rounded understanding that addresses both strategic and operational needs.
- NPS helps with the long-term strategy, CSAT improves specific touchpoints and CES optimizes processes, making these metrics critical across the customer lifecycle.
- CX metrics are only valuable when paired with qualitative feedback and used to make meaningful improvements, such as resolving pain points, streamlining processes, or enhancing customer support.
- Companies that consistently track NPS, CSAT and CES outperform competitors in customer retention, loyalty and revenue growth.
What Does CX Mean?
CX stands for Customer Experience. An accurate CX definition describes customer experience as the way consumers perceive how your brand interacts and treats them. That perception has the potential to influence the way people feel about your business, and how likely they are to do business with you and talk positively about your brand.
So, it’s easy to see why CX and customer satisfaction metrics are interchangeable. Usually, the provided customer satisfaction score is a good indicator of customer experience.
Just how important is CX, you ask? Well, consider this – according to research, it was bound to become the main brand differentiator by 2020, effectively overtaking pricing and product – statement undoubtedly confirmed years past.
On top of that, great CX is directly linked to improved brand loyalty and increased retention rates. After all, data shows that consumers who enjoy a great customer experience are 5 times more likely to recommend a brand to others. Also, customers who have a positive CX are 54% more likely to make another purchase.
Now you may have some knowledge of why CX makes the best business decisions but you need reliable methods that can collect customer insights for efficient improvements. So how do you actually perceive and measure customer satisfaction, what are the data sources, and which are the best customer satisfaction metrics to rely on. Let’s get to it, shall we?
What Is Customer Satisfaction?
It seems that there is no universally accepted definition of customer satisfaction. However, most of them agree that customer satisfaction is closely connected to expectations, hence the ongoing debate as to whether it is a cognitive or an emotionally-driven process.
There are many interesting theories used to explain customer satisfaction, but the two considered to best portray the concept are the disconfirmation and value-percept theories.
The first indicates that customers compare a new experience with a standard they already have in mind, and their satisfaction with the product/service depends on whether it lives up to the respective expectations. It is a generally accepted theory, however it is difficult to apply it to all product categories.
According to the expectancy-value theory, customers make judgments about a product’s value and its benefits, based on personal needs and wants. Customer satisfaction levels depend on how close the initial judgment is to the value the product provides after the actual purchase.
To sum up, the difference between the performance of the product a customer interacts with and the personal expectations and needs in relation to it, is what shapes customer satisfaction. Still, a rather abstract notion I would say – so how can it be translated into something measurable?
Measuring Customer Satisfaction
According to researchers, the customer satisfaction measurement can be divided into two categories: the direct measurement system (data provided directly by the customer, for example via customer satisfaction surveys) and indirect measurement system (data surfaced from sales numbers/revenue streams, app engagement, etc.).
When it comes to measuring customer satisfaction, the standard approach is by means of a scale rating. The most familiar one is the scale from 0 to 10, mostly due to its similarity with the scoring used in education systems worldwide, but also can be scales of 1 to 7, 1 to 5, emoticons, thumbs-up and stars.
Given the different information streams and the various categories, there are several tools and metrics used to approach the customer and analyze the results – data that if acted upon leads to increased customer loyalty, retention and as a result revenue.
What Metrics Measure Customer Satisfaction?
NPS, CSAT, and CES are the most commonly used customer satisfaction metrics. This is mostly due to the fact that they are rather straightforward, simple in their implementation and very easy to be understood by all staff categories as compared to complex indexes. We’ll quickly showcase what each metric is and how it works, to then help consider which one is a better option.
1. Net Promoter Score® (NPS)
What Is Net Promoter System?
NPS stands for Net Promoter Score. An easy way to define NPS is to think of it as a growth indicator. After all, it’s a customer satisfaction metric that helps you find out:
- How satisfied consumers are with your products/services;
- How loyal they are to your brand;
- How likely customers are to recommend your company to others.
At the same time, you can also use this metric to predict your customer churn rate, and find out which clients require an extra boost to become loyal.
NPS surveys are short and easy and can be sent during any stage of the customer lifecycle, by various survey channels – email, web, text messages, etc. For example, an NPS question can be triggered to pop up:
- After a customer makes a purchase or tries your product;
- After a client contacts your support team;
- When a user takes a certain action on your website;
- Whenever you want to see how your relationship with your clients is going;
- Before a meeting with a client comes up; or
- A few weeks before a long-term subscription is nearing its end.
Those are just some basic examples, and you can decide when it’s best for your brand to collect such customer feedback.
How Does NPS Work?
NPS surveys feature one question that asks consumers how likely they are to recommend your products, services, or brand to other people. Here’s an example:
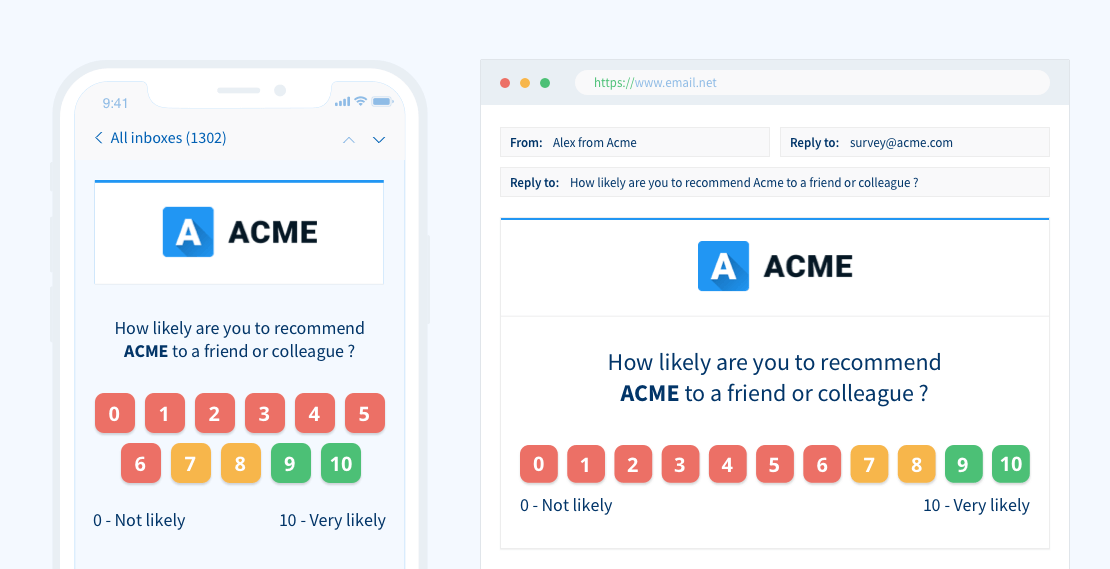
Respondents normally answer using a 0-10 scale, with 10 being “Very Likely” and 0 being “Very Unlikely.” The 0-10 scale makes it easier for you to segment customers according to their responses:
- 9-10 – Promoters (clients who love your company and will actively promote it)
- 7-8 – Passives (customers who like your company but don’t love it yet)
- 0-6 – Detractors (clients who are unhappy with your company and are at risk of churning)
Depending on how many and what kind of answers you get, your NPS score can be somewhere in the -100 and 100 range. Anything under 0 is usually a bad sign, a score between 0 and 30 is normally a good score, a score between 30 and 70 is a great score, and anything over 70 means you have very high loyalty levels.
To calculate your NPS score, you will have to subtract the percentage of Detractors from the percentage of Promoters. However, there is an easier way to determine it by using specialized NPS software, or sending surveys manually and then compiling the score by using an NPS calculator.
That’s not all, though. The single question must be followed up by an open-ended question – one that asks respondents what made them give that particular score. You can also use other open-ended questions – like asking clients what they didn’t like about your company, or what you can do to improve their customer experience.
Those kinds of questions can offer you more insight into how consumers view your brand, and what actions you need to take to enjoy higher customer satisfaction levels.
2. Customer Satisfaction Score (CSAT)
What Is CSAT?
CSAT stands for Customer Satisfaction Score (not very intuitive, we know), and it – like the name implies – is a CX metric that directly measures customer satisfaction levels.
CSAT surveys are ideally sent when you want to see how happy clients are with an action your business took, or certain aspects of your products/services.
For instance, you can send a CSAT survey after a client has completed the onboarding process to see how efficient it is and if any improvements are necessary.
How Does It Work?
CSAT surveys normally feature a question asking clients how satisfied they are with a certain service, product, or interaction with your brand. Here’s an example of a CSAT question:
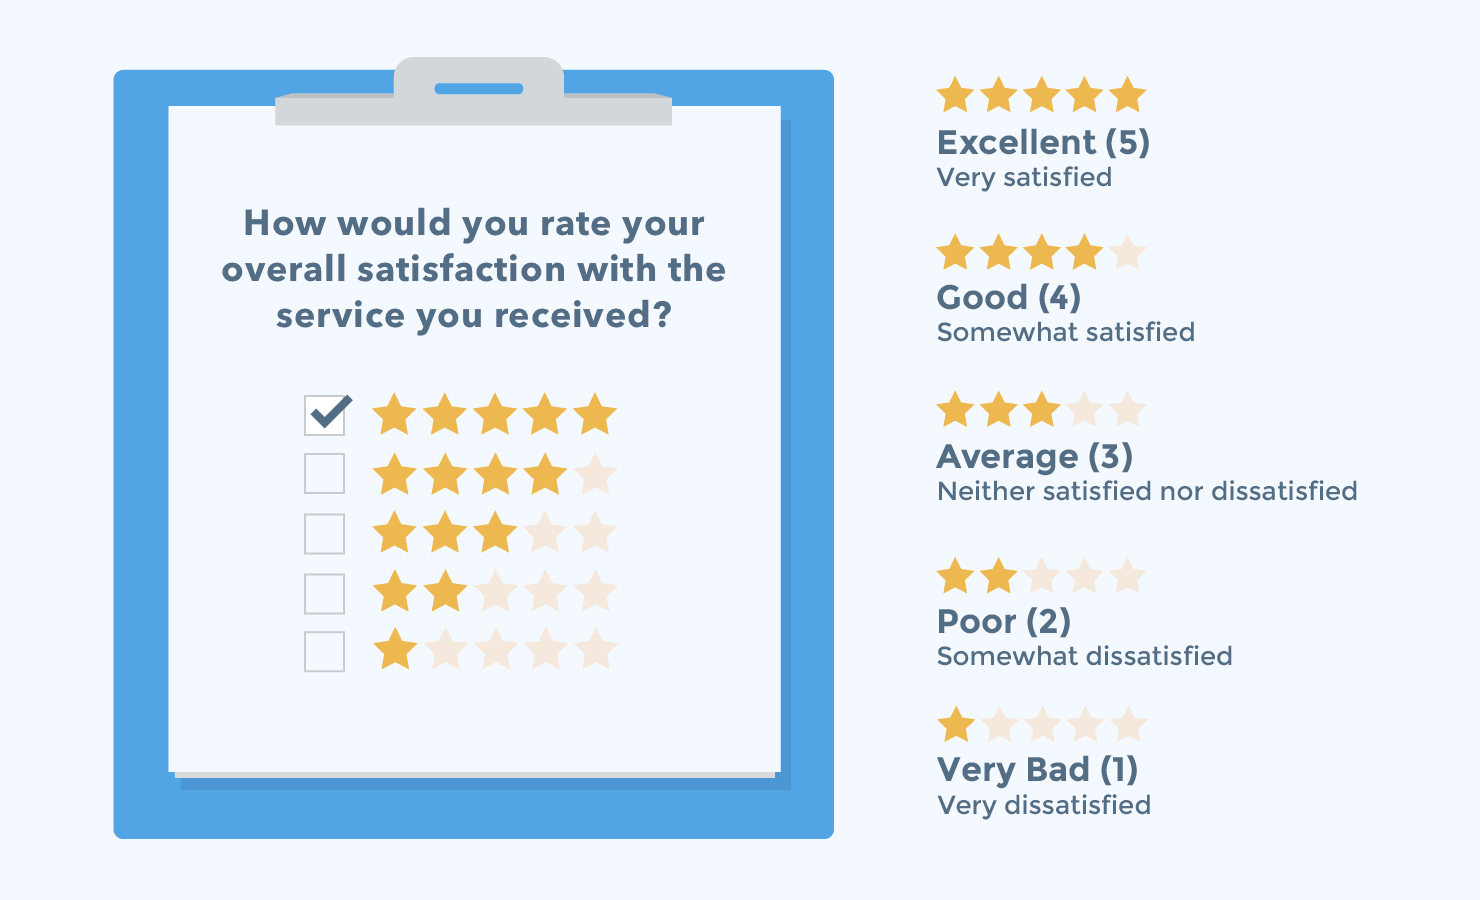
Respondents can usually rate their satisfaction with answers in the “Very Satisfied – Very Unsatisfied” range. Alternatively, you can also let respondents rate their answers in the 1-5 or 1-10 range.
Just keep in mind that the closed-ended answers people can give are not set in stone – you can customize them as much as you want to make them more relevant to your brand.
CSAT surveys aren’t limited to a single question. If you want, you can use multiple questions and have open-ended and closed-ended questions in the same survey – like the Hilton Hotels chain does, for instance.
The CSAT score is an average based on the survey results. Generally, these scores are expressed in a percentage – from 0% to 100%.
Here’s an easy way to calculate a CSAT customer satisfaction score – take the number of “Satisfied” respondents (those who answer in the “Satisfied-Very Satisfied” range, or similar parameters), divide it by the number of received responses, and multiply it by 100.
So, if 100 people respond to your survey, and 80 of them are “Satisfied,” that means you’d have an 80% CSAT score.
3. Customer Effort Score (CES)
What Is CES?
CES stands for Customer Effort Score. A good CES definition outlines it as a metric that’s used to measure customer satisfaction levels by focusing on the efforts customers make to interact with your business’ services and products.
The idea is for the survey to help you find out if customers have a hard time performing certain actions when interacting with your brand, and take the necessary actions according to the survey data to streamline processes.
CES surveys are usually used:
- Right after a client interacted with customer support
- Immediately after a customer interacted with a product/service and made a purchase/got a subscription
- Whenever a business wants to measure the overall experience consumers have with their products/services
How Does It Work?
CES surveys generally use a single question to ask clients how easy or difficult it is to perform a certain action – whether it is getting help from the support team, buying a product, or leaving a review.
For example, this is the kind of question CES surveys can use:
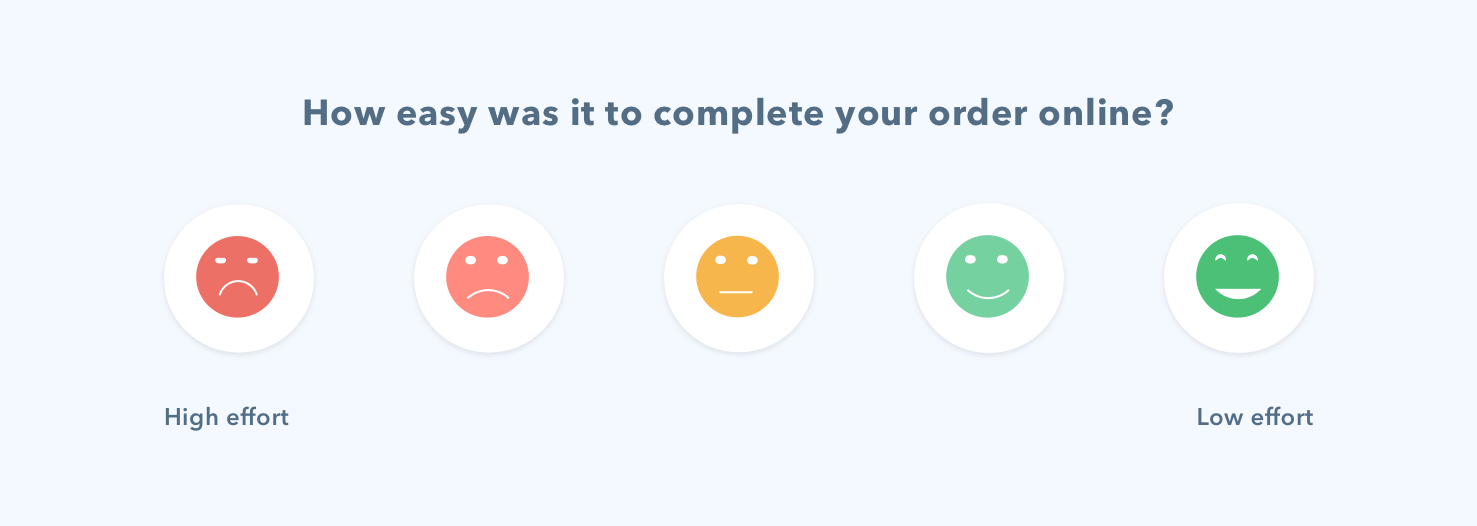
People who take the survey will get to choose between multiple answers – normally ranging from “Very Difficult” to “Very Easy”. Of course, the answers can vary – they can also be in the “Strongly Agree – Strongly Disagree” range, and they can be numbered as well.
The collected customer feedback is then analyzed to find the average.
If most answers are positive (in the “Easy-Very Easy” category), it means customer satisfaction levels are quite decent for your brand since clients have an easy time using your services/products.
If the answers are negative (in the “Difficult-Very Difficult” category), that means you are in need of improvements to make the interaction with your business easier.
Which Customer Satisfaction Metric Is Better?
NPS – Advantages and Disadvantages
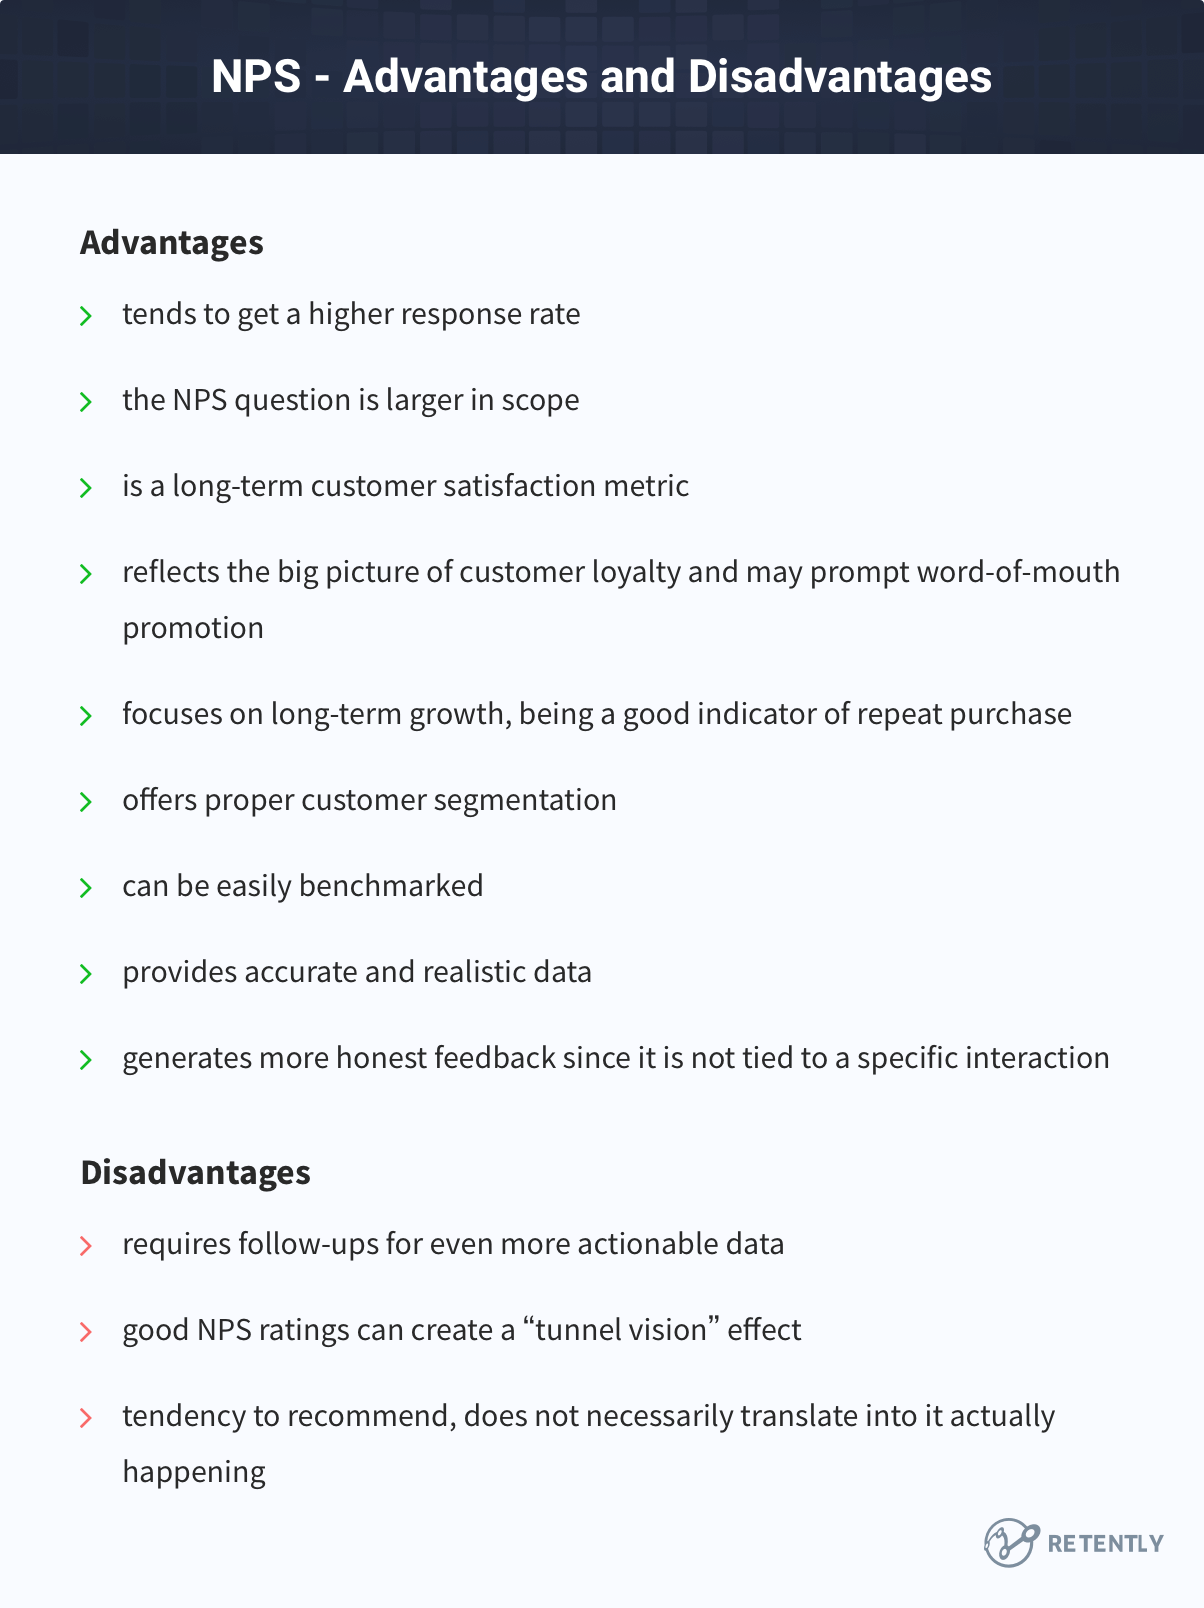
To begin with, NPS offers proper customer segmentation. You can see exactly which types of clients you need to focus your efforts on (Promoters, Passives, or Detractors) to get better results. By consistently analyzing the ratio of Promoters and Detractors, you would be able to get accurate insights about the long-term relationships you are building and whether you’ll be able to grow as quickly as you initially planned.
Besides that, NPS surveys tend to be very accurate. They use a question that’s larger in scope to get unbiased, providing accurate feedback about a product or service. Instead of asking about a specific experience, NPS uses a broad question to inquire on customers’ likelihood to recommend a company as a whole.
The effect is that the score and feedback are less likely to be affected much by particular events. As a result, your business gets specific and meaningful feedback, all with fewer outliers caused by recent positive or negative customer experiences.
Also, NPS is a long-term customer satisfaction metric. NPS focuses on the overall referability of your brand – not just on the individual customer experience. The premise is based on the fact that people are unlikely to refer a brand if they don’t trust it, and if they do refer a brand, they are more likely to stick to it.
Additionally, NPS surveys are accurate and realistic since the sample size should be randomized to cover the entire customer base, and not just the recently active users. It gives a much more realistic perspective of the overall customer sentiment.
One last NPS advantage worth mentioning is that these surveys tend to get a higher response rate. While the average survey has a response rate of just over 3 percent, NPS surveys regularly earn response rates in the 10 to 30% range. It’s usually due to having just one question, and because a numerical scale makes it easy for respondents to offer quick feedback since they don’t have to read any additional text.
And that much-higher-than-average response rate means that even a small NPS survey audience can produce meaningful, statistically significant data that your business can use to improve customer retention and generate more revenue.
Now, in terms of disadvantages, most NPS surveys do require follow-ups, so you can’t really rely just on one single question. Also, good NPS ratings can create a “tunnel vision” effect, where businesses think they’re on the right track, and that’s it.
While a high NPS score is a great accomplishment, you can’t just call it a day after getting the results. You need to act on that score, and start engaging your Promoters to advocate your brand to others, and become even more proactive in addressing the issues faced by the Detractors. NPS works best when paired with a proper voice of the customer program.
CES – Advantages and Disadvantages
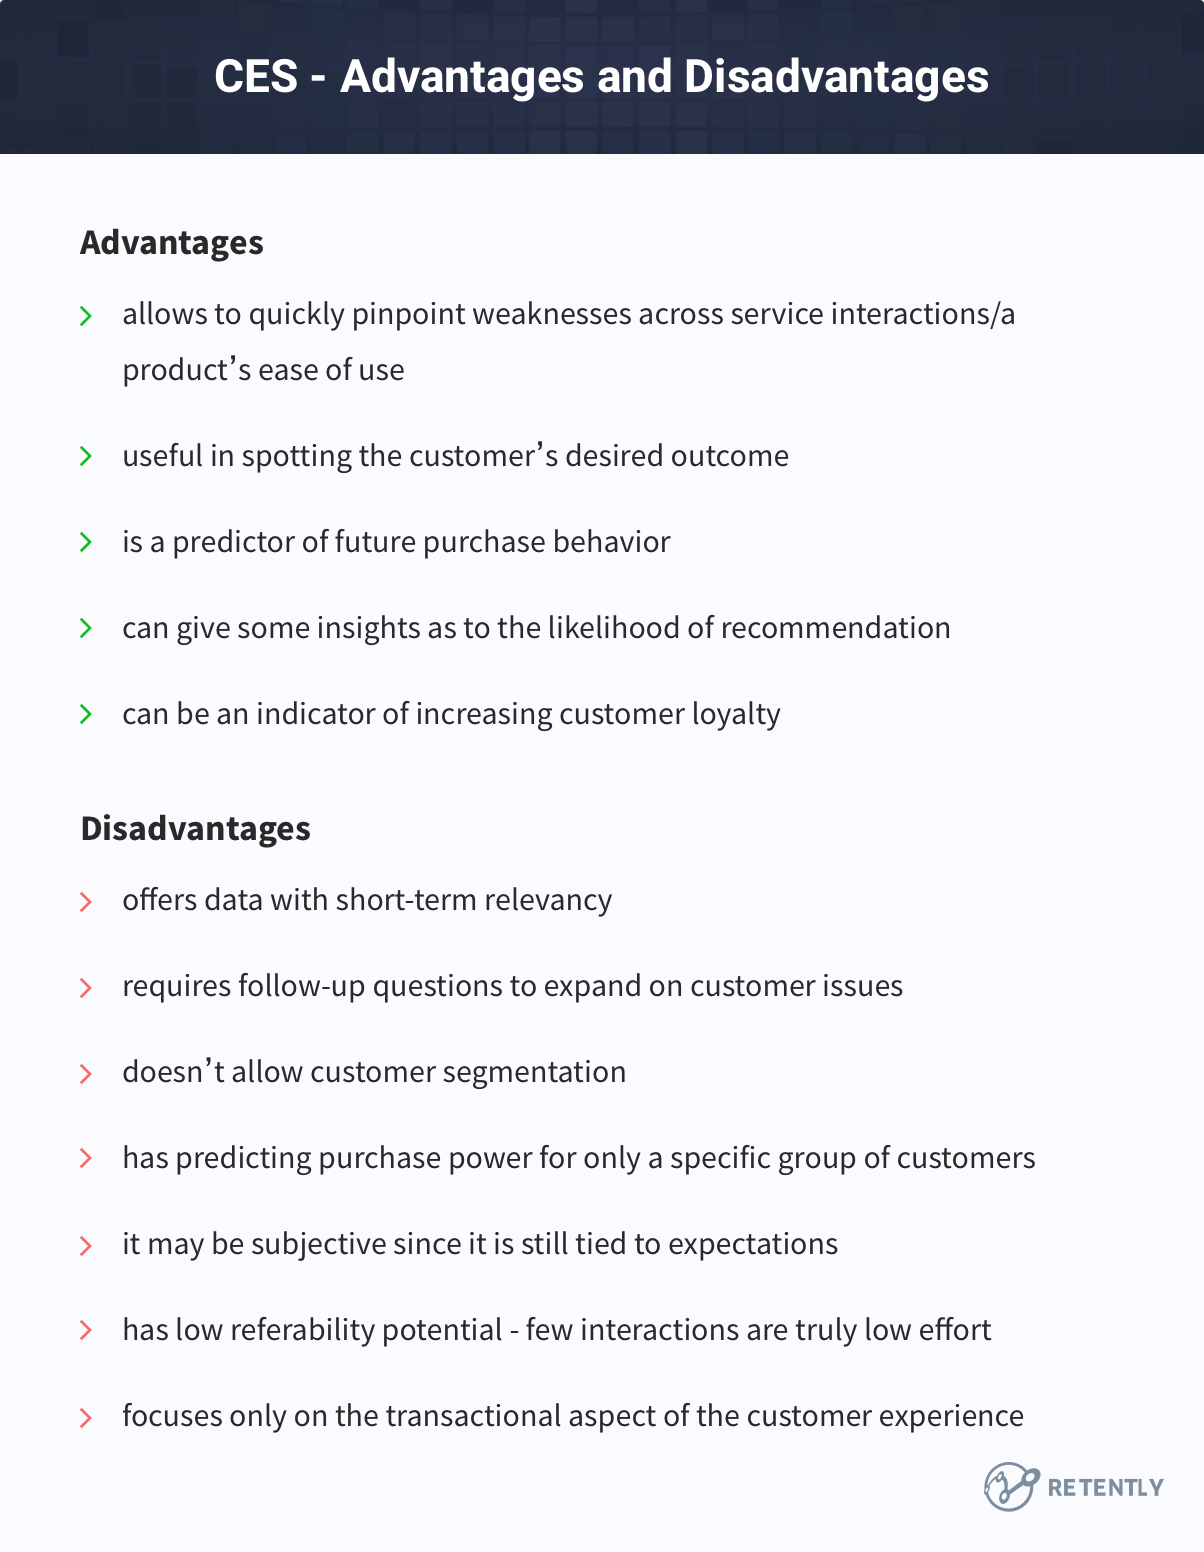
The strongest incentive to use CES surveys is the fact that, according to HBR research, the results are a strong predictor of future purchase behavior – given that 94% of consumers who report their interactions with a brand being “low effort” will repurchase.
Also, another research shows that 81% of consumers who report that their interactions with businesses are “high effort” say they would speak about the brand in question in a negative manner. What does that mean? That CES could also give you insights into how likely your customers are to refer you to others. The idea would be that if it’s very easy for them to do business with you, they’d be more likely to promote you.
Lastly, due to the survey’s focus on customer effort, it can offer you actionable data that allows you to quickly pinpoint weaknesses across different types of client interactions with your brand.
Now, onto the drawbacks – one of the main problems with CES is that it doesn’t allow any customer segmentation. Basically, you can’t find out what type of customer had trouble interacting with your product or learn about the kind of relationship you have with a specific customer.
What’s more, you can only find out if clients have trouble using a service or product. You can’t find out why they are having that problem in the first place, and what the exact issue is.
For instance, a customer might feel it was hard for them to get something from your brand that your business doesn’t normally offer. In that case, the CES results show that the said customer had trouble interacting with your business, when – in reality – that kind of information might be irrelevant to you. That’s why it is important to complement the surveys with follow-up questions allowing customers to expand on the problems they encountered using your service.
CSAT – Advantages and Disadvantages
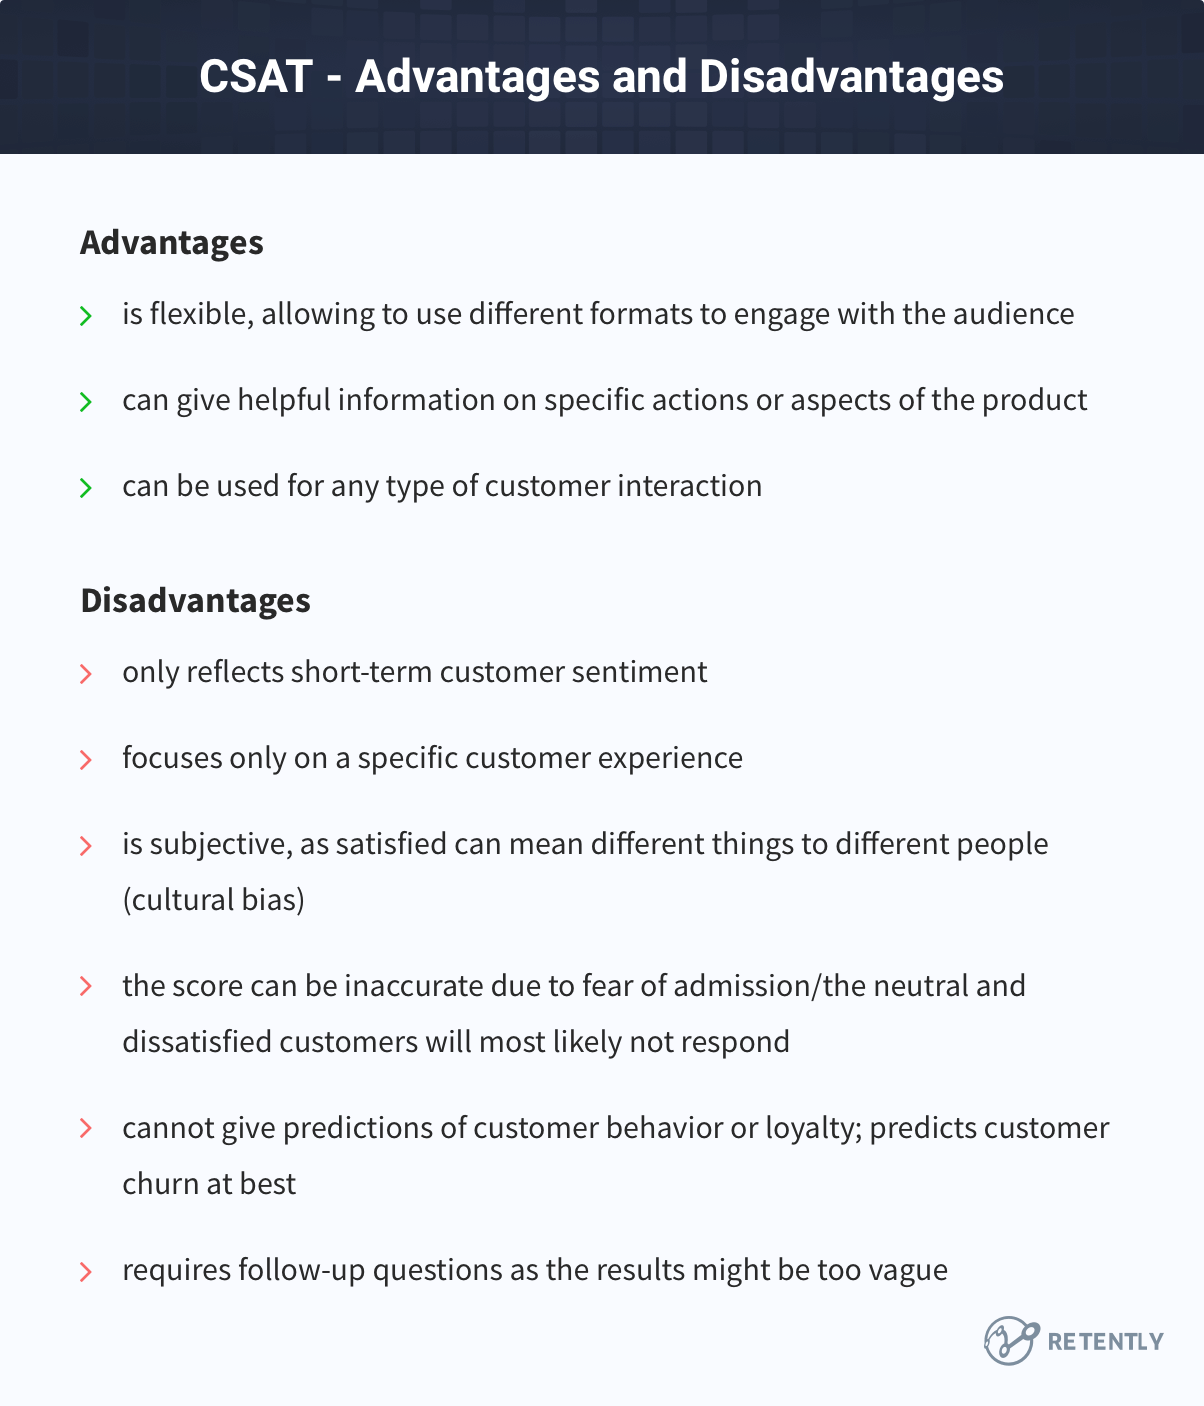
CSAT can be a flexible customer satisfaction metric, which is its strongest suit. You can easily customize questions to make an in-depth analysis of your brand’s strengths and weaknesses. Since the rating scale can be tied to the context, it allows you to use different indicators (like numeric scales, stars, emojis) that appeal to your audience.
Also, CSAT surveys allow you to use different formats – from simple to complex – to engage with your audience. The more thorough formats can be very useful if you have a bigger business (like a hotel chain) and don’t want to bombard customers with multiple one-question surveys.
Now for the drawbacks – the first issue with CSAT is that it only reflects short-term customer sentiment, as the results are normally based on how they are feeling on a given day. There’s also the problem of subjectivity, as “satisfied” can mean different things to different people.
Case in point – there’s the problem of cultural bias. According to a Psychological Science article, people from more individualistic countries (like the US) are likely to choose the more “extreme” sides (“Very Satisfied,” “Very Dissatisfied”) than people in collectivist countries (someone from Japan who’s more likely to offer a “Not Satisfied” or “Satisfied” rating).
Your CSAT score could also be skewed by clients in the “Neutral” or “Dissatisfied” category who might not bother to fill out the whole survey. Not to mention the score could be inaccurate due to fear of admission. Users who rely on your brand’s customer service on a daily basis might be afraid of being honest with the brand – especially if they think that any negative feedback could impact the turn-around time or ongoing business relationship. You can take that fear of the table by using anonymous surveys where respondents can leave their names only if they feel comfortable to.
One last issue to consider with this type of survey is that the CSAT score doesn’t really tell you a lot about consumer loyalty. At best, a low score would be able to predict customer churn.
For instance, having a high score doesn’t mean you can actually predict repeat business. Yes, you can find out if clients are happy with what you offer, but it doesn’t necessarily mean they’re likely to promote your brand. You can just take a guess, which isn’t a very reliable method.
NPS, CSAT and CES – The Bottom Line
It would be unfair to compare NPS, CSAT and CES as they deal with different aspects of the customer journey. They are connected, complement each other and should be used together at specific stages of the customer lifecycle.
CSAT surveys, despite positive scores, can’t predict customer loyalty, but they can give you helpful information on specific actions and features. CES, on the other hand, offers value in specific situations, such as assessing service performance or a product’s ease of use. These two measure isolated cases at a specific touchpoint, but the feedback will directly contribute to the way you shape your product and guide the customer journey.
Although they usually offer information with short-term relevancy, the results of these surveys should not be underestimated.
For instance, if your customers have difficulties in using a specific product, a quick CES survey with a follow-up question will help identify the issues and solve them promptly. If your customers are dissatisfied with your service, you would want to know it at an early stage. Of course, there is always a possibility that your service isn’t what some users are looking for, so CSAT results will be ambiguous, but a follow-up question will help sort it out. Finally, if your customers aren’t happy with your offering at different stages of their journey, your NPS will be lower.
NPS deals with broader aspects, and hence its appeal. It generates relevant feedback that your business can use to improve consumers’ perception of your brand. NPS does that by asking customers or users a broad follow-up question: “How can we improve?”
Because the standard NPS question isn’t related to a specific experience (like CSAT or CES), respondents are free to talk about the specific things they like or dislike about your product or service.
There’s no forced relevance. Instead, customers are free to provide their honest feedback on any aspect of your product that upsets, frustrates, or disappoints them. They have control over what is and isn’t relevant, and – as a result – can provide meaningful feedback.
The end result is direct and actionable feedback your team can use to make real changes to your product in order to boost retention and increase the monthly recurring revenue.
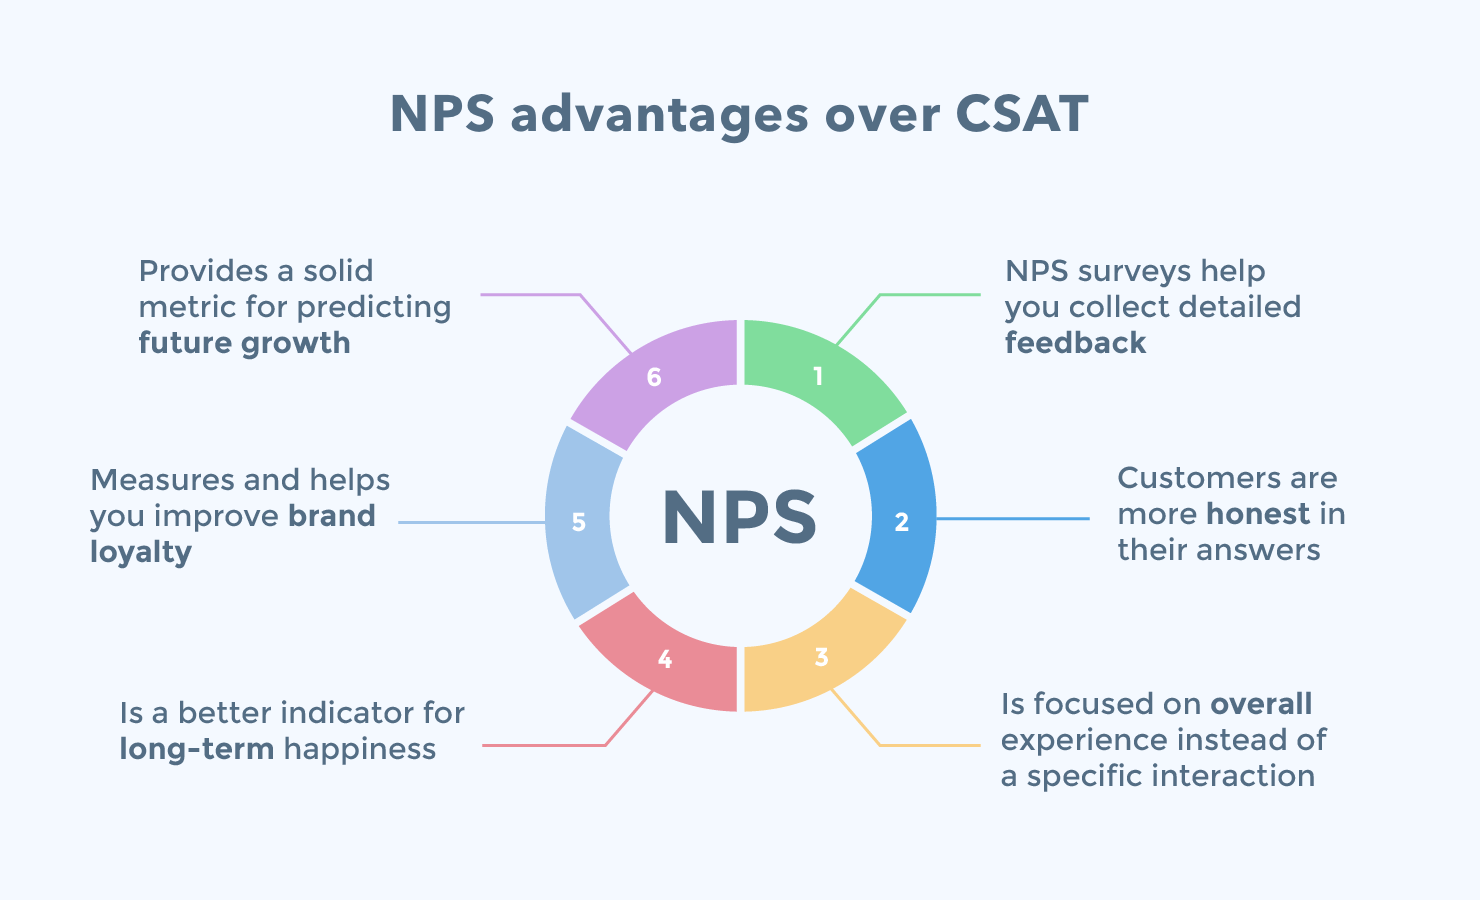
In addition, NPS has a serious focus on long-term growth. We’ve previously written about why Net Promoter Score is the ultimate growth hacking metric. At its core, it’s simple — there’s no element as closely correlated with long-term, sustainable business growth as customer satisfaction.
Because NPS asks customers how likely they are to recommend your product/service to others, it gives you an accurate view not just of how customers see your product, but how likely they are to help it grow organically.
It also lets you stay on top of growth liabilities, such as the potential for negative publicity from Passives and Detractors that are disappointed or frustrated with your product. By acting quickly to close the feedback loop, it can even prevent you from losing customers.
NPS is the equivalent of taking a pair of blinders off. Not only is the data unbiased and accurate — it’s put into context as an aspect of your business’s growth, helping you to make smarter and more effective decisions.
Of course, that doesn’t mean you should disconsider the other metrics. For instance, CES is still a useful way to get direct information about how clients interact with your services and products, and what tweaks you need to make to streamline the experience. You could actually use CES alongside NPS to measure consumer loyalty and referral marketing alongside how user-friendly your products/services are.
Quick Wins: How to Decide Which CX Metric to Use
- Choose NPS if you want to measure loyalty and track customer advocacy over time. It’s great for identifying trends, assessing overall brand perception and understanding your brand’s long-term relationship with customers.
- Choose CSAT if you need immediate feedback on specific transactions or interactions. It’s ideal for identifying areas that need quick fixes in order to improve individual touchpoints.
- Choose CES if your focus is on reducing friction and streamlining processes. It’s perfect for understanding how easy it is for customers to interact with your business.
While these metrics have different perspectives, they’re most powerful when used together. NPS gives you the big picture, CSAT dives into the details, and CES helps you optimize the journey – creating a comprehensive strategy for improving the customer experience.
The key to success is turning feedback into action. Whether it’s fine-tuning a process based on CES insights, resolving a service issue flagged by CSAT, or nurturing brand advocates identified through NPS, every step you take will drive meaningful results for your business.
Ready to Start Tracking Customer Satisfaction Metrics?
If you want to learn how your brand is perceived by your customers, how satisfied they are with your service and how simple it is to use, you’ll be happy to know it’s quite easy to get started. All you need to do is sign-up for a trial.
It’s extremely user-friendly, you can set up complex automation scenarios with just a few clicks, and fully customize your survey templates to make them better fit your brand’s identity. Don’t forget about the wording – include only the questions that matter, by tailoring them to your specific needs using Retently’s survey maker.
Additionally, you can set up triggers to automatically send out surveys whenever your customers perform a certain action, use segmentation to send targeted surveys, and even integrate numerous other services with Retently.



 Greg Raileanu


 Alex Bitca

 Christina Sol