


Table of Contents
Keeping customers happy isn’t just about responding to tickets or processing refunds. It’s about understanding what’s working, what’s not, and what needs fixing before it turns into a bigger issue. And that’s exactly what CX reports help with – not just reacting to problems, but preventing them.
Yet, not all reports serve the same purpose. A weekly report keeps everyone in the loop with real-time trends, while a monthly or yearly report helps you track long-term patterns and make strategic decisions. But, here’s the challenge – not all CX reports are useful. Some reports get ignored because they track the wrong things, while others fail to connect the dots between customer issues and business impact.
That’s why we interviewed over 20 CX professionals managing fast-scaling ecommerce brands and high-performing customer support teams to uncover what makes a CX report actionable, relevant, and actually useful for stakeholders. Their firsthand experiences, challenges, and strategies have shaped the recommendations you’ll find here.
The result? A set of best practices for building CX reports that:
- Give support teams a clear view of daily trends and recurring issues
- Provide leadership with high-impact insights that drive strategic improvements
- Are customized for different teams – so everyone gets the data they need
- Turn customer feedback into real action, not just numbers on a dashboard
Their firsthand experiences, challenges, and strategies have shaped the recommendations you’ll find here.
What’s in it for you? We’re going to break down everything you need to know to create effective weekly and monthly CX reports. Here’s what you’ll learn:
- How to structure your recurring CX reports so they’re easy to read and actually useful.
- Key metrics to include (or skip)
- Actionable insights that go beyond the data and help drive real improvements.
- Ready-to-use examples for different reporting styles, whether you’re all about the numbers, customer feedback, or a mix of both. Shout out to Eli Weiss, former Director of CX at Jones Road Beauty, whose example we’ll actively use throughout this guide to showcase data visualization.
So, let’s break it down and look into essential data to include in your CX template.
Weekly, Monthly, Quarterly & Yearly CX Reports: What’s the Difference?
CX reports come in different flavors, depending on how often you review them. Here’s how they break down:
✅ Weekly Reports → The “What’s Happening Now” Report
- Covers the latest ticket trends, response times, customer complaints, and quick wins.
- Helps teams react fast to emerging issues in different CX touchpoints (e.g., an unexpected spike in refund requests or an increase in failed subscription payments).
- Tracks customer pain points in real-time. For example, if 20+ customers ask about product sizing, the website may need clearer information.
- Ideal for customer support & CX managers who need real-time insights to prevent issues from escalating.
📊 Key Metrics to Include:
- Ticket Volume: Are we handling more tickets than usual?
- First Reply Time & Resolution Time: Are customers waiting longer?
- One-Touch Resolution Rate: Are we resolving issues efficiently, or are cases being reopened?
- Top 3 Customer Complaints This Week: What’s causing the most frustration?
- Quick Wins: What can we fix immediately? (e.g., updating an FAQ, adjusting a chatbot response, rewording product descriptions).
✅ Monthly Reports → The “What’s Working (and What’s Not)” Report
- Provides a bigger picture – comparing key CX metrics to the previous month.
- Identifies patterns & recurring pain points in customer feedback.
- Prevents slow escalations of critical issues. For example, a well-known company experienced a steady rise in complaints about a nail glue product. At first, the increase seemed minor, but after three months, it became clear that the issue was widespread and required escalation to the factory. A well-structured monthly report would have surfaced this pattern earlier, helping the company act faster to address the defect.
- Looks beyond support tickets to assess CX trends:
- Are we seeing more complaints about a specific carrier? → Time to reassess shipping partners.
- Are customers struggling with a new checkout process? → Test the UX and optimize accordingly.
- Did the latest promotional campaign lead to increased refund requests? → Ensure the offer terms are clear and well-communicated.
- Perfect for CX managers, operations, and leadership teams who need strategic insights to optimize operations and refine policies.
📊 Key Metrics to Include:
- CSAT/NPS Trends: Did customer satisfaction shift?
- Refund & Return Rates: Are they rising? Why?
- Product Launch Performance: What were the most common customer questions about the new release?
- Shipping Performance: Did delays increase? Are certain carriers underperforming?
- Marketing Campaign Impact: Did a recent ad increase ticket volume? What were the most common complaints related to the campaign?
✅ Quarterly Reports → The “Are We On Track?” Report
- A middle ground between monthly and yearly reports, helping teams validate CX trends before they become long-term issues.
- Looks at performance across the last 3 months to assess progress on key CX initiatives and guide cross-functional decisions.
- Best for identifying deeper-rooted issues that aren’t visible in weekly or monthly reports. For example, if refund requests steadily increased over three months, a quarterly report can assess whether this is a short-term fluctuation or a sign of a broader issue (e.g., product quality, unclear policies, or marketing misalignment). Or for instance, a company launching a new subscription plan can track Q1 vs. Q2 churn rates to determine whether new retention strategies are working.
- Helps align CX insights with product, marketing, and logistics teams to drive bigger-picture improvements.
📊 Key Metrics to Include:
- Retention & Churn Trends: Are customers staying longer or leaving faster than in previous quarters?
- Customer Complaint Patterns: Which issues have been escalating or improving over time?
- Impact of CX Initiatives: Are new self-service tools, AI chatbots, or policy changes reducing ticket volume?
- Customer Sentiment by Region: Are certain locations experiencing more shipping or fulfillment-related complaints?
- Cross-Team Collaboration Impact: Has logistics or product quality improved based on CX feedback?
✅ Yearly Reports → The “Are We Getting Better?” Report
- Zooms out to analyze long-term performance trends.
- Tracks how customer sentiment, retention, and support efficiency have evolved over time.
- Looks at macro-level insights beyond support tickets:
- Has the perception of our brand improved or declined? (customer sentiment via NPS, CSAT, CES)
- How has our customer retention rate changed year-over-year? (retention and churn trends)
- Are we reducing the number of recurring complaints about product quality?
- Which operational investments (e.g., AI chatbots, expanded self-service) have improved CX the most?
- Useful for leadership, c-suite, stakeholders, and annual strategy meetings.
Each of these reports serves a different purpose, but they all share one goal: improving the customer experience and driving business growth.
Where Does the Data Come From? (Hint: More Than Just Tickets!)
A good CX report pulls data from multiple sources to give a full 360° view of your customer interactions. Different aspects of the customer journey require different tools, from helpdesk performance to returns, subscription management, and post-purchase experience. Here’s where the magic happens:
- Helpdesk (Gorgias, Gladly, Zendesk, Kustomer, RichPanel) → Tracks ticket volume, response times, resolution rates, agent performance, and stand-out support issues.
- Review Platforms (Yotpo, Okendo, Trustpilot) → Collects customer ratings, sentiment, and common praises or complaints.
- Ecommerce Platform (Shopify, Magento, BigCommerce) → Provides order data, fulfillment status, and purchase trends.
- Email Marketing (Klaviyo) → Automates personalized email flows, tracks customer engagement and analyzes the impact of campaigns on retention and revenue.
- SMS Marketing (Postscript, Attentive) → Delivers targeted messaging, tracks conversion rates, and enhances direct customer engagement through real-time SMS communication.
- Returns & Refunds Management (Loop Returns, Returnly, Happy Returns, Return Go) → Tracks return reasons, refund vs. exchange ratios, and financial impact of returns.
- Subscription Platforms (Recharge, Skio, Bold Subscriptions) → Provides churn data, failed payments, and customer retention insights.
- Post-Purchase CX Tools (Wonderment, Malomo, Narvar) → Helps monitor shipment tracking issues, delivery updates, and post-purchase customer sentiment.
- NPS & CSAT surveys (Retently) → Captures customer loyalty, satisfaction, and open-ended feedback via NPS, CSAT and CES surveys.
These help you see the full picture of your customer experience – beyond just “how many tickets we closed” to why customers are reaching out in the first place.
Numbers vs. Insights: Striking the Right Balance
It’s easy to get lost in metrics and KPIs, but CX isn’t just about numbers. It’s also about understanding how customers feel. That’s why the best CX reports balance quantitative data (stats, graphs, trends) with qualitative insights (customer feedback, sentiment analysis, and real examples).
📊 Quantitative Data (Metrics & KPIs – The “What”) →
- First response time
- Resolution time
- Number of tickets created & resolved
- NPS, CSAT, and CES scores
- Return rates and refund percentages
💬 Qualitative Insights (Customer Sentiment & Context – The “Why”) →
- What are customers actually saying in their feedback?
- What are the top recurring issues in support tickets?
- Are product reviews mentioning the same pain points?
- What’s the emotional tone of customer responses?
- Are certain products causing frustration or confusion?
- Are customers happy but frustrated with one specific thing (like slow delivery)?
The best reports don’t just show data – they help teams connect the dots between what’s happening and why.
Understanding the Core Differences in CX Reporting
Depending on your business goals, team focus, and even the tools you use, CX reports can look very different. Let’s break down the three main styles of CX reporting: Support/Service-Focused, Customer Experience (CX)-Centric, and the Balanced Middle-Ground. Understanding these will help you figure out what works best for your team.
1. Support/Service-Focused Reports: All About the Numbers
If your team lives and breathes in tools like Gorgias, Zendesk, or Gladly, this type of report will feel like home. It’s data-driven, metrics-packed, and laser-focused on support operations. Think spreadsheets filled with numbers rather than deep analysis – because in a support-driven environment, hitting KPIs is the priority.
Key Features:
- Ticket Data is King: You’ll see metrics like how many tickets were created, resolved, or still pending. It’s all about volume and speed. The report tracks trends across days, weeks, and months to identify workload shifts.
- Metrics That Matter: First response time, average resolution time, and agent performance leaderboards are front and center. If the goal is to close tickets in under 5 minutes, this report will show how well (or how poorly) the team is hitting that benchmark.
- Straightforward, No-Frills: These reports often skip the deep analysis. The focus is on “what happened” rather than “why it happened.” They track operational KPIs, not customer insights. If tickets took longer to resolve than usual, the report won’t explain why – but it will highlight the numbers.
- Correlating All Data to Tickets: While teams might check Shopify or other tools, everything ties back to ticket performance. If there’s a surge in refund requests, the focus isn’t on why customers are returning products – it’s on how efficiently support is handling those tickets.
Best For:
Support teams that need to track performance efficiency, manage workload distribution, and identify operational bottlenecks quickly; or managers who need hard numbers to monitor KPIs over time. Therefore, these reports aren’t about finding deep insights but ensuring tickets are handled fast, efficiently, and within set KPIs.
2. Customer Experience (CX)-Centric Reports: Telling the Customer Story
While support-focused reports are all about the numbers, CX-centric reports dive into the “why” behind the data. They’re less concerned with how many tickets were closed and more interested in what those tickets (and other feedback sources) are telling you about your customers. They analyze patterns, surface insights, and highlight key takeaways to improve the overall customer journey.
Key Features:
- Feedback First: Customer satisfaction metrics like NPS (Net Promoter Score), CSAT (Customer Satisfaction Score), and CES (Customer Effort Score) take center stage. Yet the real value comes from customer comments. Therefore, the focus is not just on what the scores are, but on what’s driving them.
- Insights Over Data Dumps: Expect sentiment analysis, pattern recognition, and detailed breakdowns of customer feedback. What are customers consistently praising – the so-called “Customer Love Section”? What’s frustrating them?
- Actionable Recommendations: These reports don’t just track what’s happening, but often include recommendations for improvement based on the feedback trends identified. For example, if shipping delays are a growing complaint, the report will highlight it, show customer impact, and suggest the next steps for resolution.
Best For:
Teams focused on improving the overall customer journey, identifying pain points, and driving strategic changes based on customer insights.
3. The Balanced Middle-Ground Approach: Best of Both Worlds
Why choose between data and insights when you can have both? The balanced approach blends quantitative metrics with qualitative feedback, giving a holistic view of customer experience.
Key Features:
- Start with Highlights: These reports often kick off with a summary of key insights – what’s going well, what needs attention, and any standout trends.
- Metrics Meet Insights: You’ll still see performance metrics (like ticket volumes and response times) alongside feedback-driven data (NPS trends, customer comments, review sentiment).
- Trend Tracking: This approach excels at showing how things change over time – whether it’s month-over-month shifts in CSAT scores or emerging trends in support tickets.
Best For:
Businesses that want a comprehensive view of both operational efficiency and customer satisfaction. Perfect for cross-functional teams where support, CX, and leadership all need to stay aligned.
4. Choosing the Right Approach
The style you choose depends on your team’s goals:
- If efficiency is your priority: Go with the Support/Service-Focused report.
- If understanding the voice of the customer matters most: Opt for the CX-Centric report.
- If you need a full 360° view: The Balanced Middle-Ground is your best bet.
No matter which approach you lean towards, the key is to make your reports actionable. After all, the best reports don’t just highlight problems – they help you solve them.Now, let’s break down exactly what goes into a strong CX report and how to build templates that work for your business.
The Core Structure of a CX Report
A good CX report isn’t just a pile of data – it’s a clear, structured summary that helps your team make informed decisions. Whether it’s a weekly pulse check or a monthly deep dive, your report should follow a logical flow so stakeholders can quickly grasp what’s happening and what needs attention.
The core structure of a CX report includes:
- Executive Summary & Key Takeaways (quick insights & action points)
- Performance Matrix Overview (KPI tracking & trend analysis)
- Detailed Insights (tickets, feedback, reviews, returns, etc.)
- Key Priorities & Action Items (what to focus on next)
Let’s break it down.
1. Executive Summary & Key Takeaways: The Quick Snapshot
This section is the TL;DR (too long; didn’t read) of your report – a quick, digestible, high-level snapshot of the most important customer experience metrics, trends, and immediate action points. Think of it as a dashboard-style overview that highlights what’s working, what’s not, and what needs fixing ASAP.
📌 What to Include in the Executive Summary:
- Key CX metrics: Ticket volume, CX trends, response times
- Performance summary: This period vs. the last period (weekly/monthly comparison)
- Top 3 customer issues & trends: Recurring support requests, common complaints
- Urgent action points & recommendations: Where should the team focus next?
- Team Updates/News: For example, launches you are working on.

🔍 Why This Section Matters
- Keeps leadership informed at a glance – they don’t have time to dig into every detail. This section lets them grasp the key takeaways in under a minute. If something catches their eye, they can dive deeper into the specific sections of the report.
- Helps teams stay focused on the most critical issues instead of getting lost in data.
- Aligns priorities across departments – CX, support, marketing, logistics, and product teams all get the same view of customer concerns.
Pro Tip: If your audience includes execs or non-CX teams, use visuals like graphs, trend lines, or bullet points to make insights digestible.
What’s Next? With the big-picture summary in place, we can dive deeper into performance trends and specific insights. Next up: the Performance Matrix Overview.
2. Performance Matrix Overview
This section focuses on key CX metrics over time, helping you understand whether things are improving, staying flat, or getting worse. The goal of the Performance Matrix is simple:
- ✅ Highlight existing KPIs
- ✅ Identify trends before they become major issues
- ✅ Compare current performance with past periods
- ✅ Spot areas where the team is excelling (or struggling)
- ✅ Align CX efforts with business growth
📌 Core KPIs to Track
Your helpdesk, review, and feedback tools provide a ton of data, but not all of it is equally important. A performance matrix focuses on the most actionable CX metrics:
- Tickets Created vs. Resolved → Is the team keeping up with customer demand?
- First Response Time & Average Resolution Time → How fast are we helping customers?
- Escalation Rate & One-Touch Resolution → Are tickets being resolved efficiently?
- Agent Performance → Who’s performing well? Where’s coaching needed? These are leaderboards showing individual agent metrics like speed, customer satisfaction, and ticket load.

Historical Comparisons: Why They Matter
Looking at just one period of data can be misleading. Maybe ticket volume spiked – but is that normal for this time of year? Is first response time slower because of staffing shortages, or is this a long-term problem?
That’s why historical comparisons are essential. They provide context by comparing:
- This week/month vs. previous week/month → Short-term trends, recent improvements/issues
- This month vs. the same month last year → Seasonal patterns, long-term growth
Pro Tip:
- Use comparative visuals like bar charts or line graphs to show changes over time.
- Highlight anomalies. For example, if first response times suddenly increased, add a quick note explaining why: “First response time rose from 2.1 to 3.4 hours due to high ticket volume after Black Friday sales.”
Tracking CX trends over time helps you make data-driven decisions instead of reacting to short-term fluctuations.
Final Thoughts: Turning Data into Action
A Performance Matrix isn’t just about tracking numbers but making data-driven decisions that improve customer experience and help support teams succeed.
- Focus on Trends: Don’t just present numbers – highlight what’s changed and why it matters.
- Make It Actionable: Every metric should tell you if something needs attention (like that ⬆ in response time).
- Keep It Visual: Emojis, bullet points, and clear tables make the report easier (and more fun) to read.
Next up: Diving deeper into ticket data insights, tag analysis, and customer feedback trends!
3. Ticket Data Insights & Tag Analysis
Now that we’ve covered overall CX performance, let’s zoom in on what’s actually happening inside support tickets. Metrics like ticket volume, response time, and resolution time tell us how busy the team is, but tags and customer inquiries tell us why customers are reaching out.
By analyzing ticket categories, contact channels, and common trends, we can:
- ✅ Identify recurring customer pain points (billing issues, delivery delays, returns).
- ✅ Spot seasonal patterns (e.g., more shipping issues during holiday sales).
- ✅ Improve self-service resources (e.g., if the same questions keep coming up).
Ticket Volume Breakdown
Understanding where your tickets are coming from and what they’re about helps you spot problem areas quickly and allocate resources efficiently.
What to Include:
A. Key Topic Starters
Every ecommerce business sees certain common ticket types. Breaking them down helps prioritize problem areas and improve efficiency.
- Billing & Payments → Refunds, incorrect charges, subscription issues
- Delivery Issues → Delayed shipments, lost packages, tracking problems
- Product Questions → Sizing, usage instructions, warranty requests
- Returns & Exchanges → Refund processing times, defective items
- Account Issues → Login problems, subscription cancellations
- Technical Support → Website glitches, checkout issues
B. Channel Distribution
See which channels are most active – email, chat, phone, social media, etc. This helps identify where your support team might be overwhelmed. Tracking where tickets are coming from helps allocate resources efficiently and identify channel-specific trends.
C. Common Spikes & Seasonal Patterns
Are there trends during certain times like holidays, sales events, or product launches?
For example:
📅 Holiday Sales & Peak Seasons – Expect more delivery-related tickets as shipping volumes surge.
🚀 Product Launches – A spike in product questions & reviews can signal excitement or confusion about a new product.
🛍 Promotional Campaigns – More billing & discount-related inquiries (e.g., “Why didn’t my coupon apply?”).
🔄 Post-Purchase Period – Refund & return tickets usually increase after major sales events.
This breakdown helps teams pinpoint where issues are escalating and which channels need more support.

Tag Analysis & Emerging Trends
Ticket tags are gold mines of customer insights. They help categorize why customers are reaching out and reveal trends that raw numbers can’t show.
🎯 Why Tag Analysis Matters
- ✅ Detect common issues early before they escalate.
- ✅ Identify trends over time (Are refund complaints increasing? Are customers struggling with a new feature?).
- ✅ Improve self-service resources (FAQs, chatbot responses, help center).
- ✅ Give other teams insights – product, marketing, and logistics all benefit from CX insights.
Thus, tags are like breadcrumbs that lead you to the root cause of recurring issues. By analyzing ticket tags, you can identify emerging trends and optimize your CX strategy accordingly.
What to Include:
A. Top Recurring Themes: Most helpdesk tools like Gorgias, Gladly, and Zendesk allow tagging, which helps categorize customer inquiries into actionable themes. What issues are coming up again and again? Examples: “Order Delayed”, “Size Issues”, “Payment Failed”.
Here’s an example breakdown of the most common ticket tags for an ecommerce brand:

B. Sentiment Analysis: Not all ticket data is quantifiable – some of the most valuable insights come from what customers actually say in support conversations or post-support surveys. That’s where sentiment analysis comes in. Use automated tools to gauge the mood of customer conversations – are they frustrated, neutral, or satisfied?
How It Works:
- CX tools like Retently can analyze the tone & sentiment of customer messages.
- Keywords like “frustrated,” “disappointed,” or “angry” help flag negative sentiment.
- Positive sentiment can also be tracked (e.g., “Thanks for the quick help!”).
- These responses can be categorized into trends (e.g., “50% of refund-related tickets contain negative sentiment”).
C. Impact on CX Strategy: Based on the data, what actions can improve the customer experience? Should you:
- Improve FAQs to reduce repetitive questions?
- Adjust automated responses to handle common issues more effectively?
- Provide additional agent training on complex topics?
- Involve other teams since many CX issues aren’t just support problems, they signal bigger issues in product, marketing, or logistics.

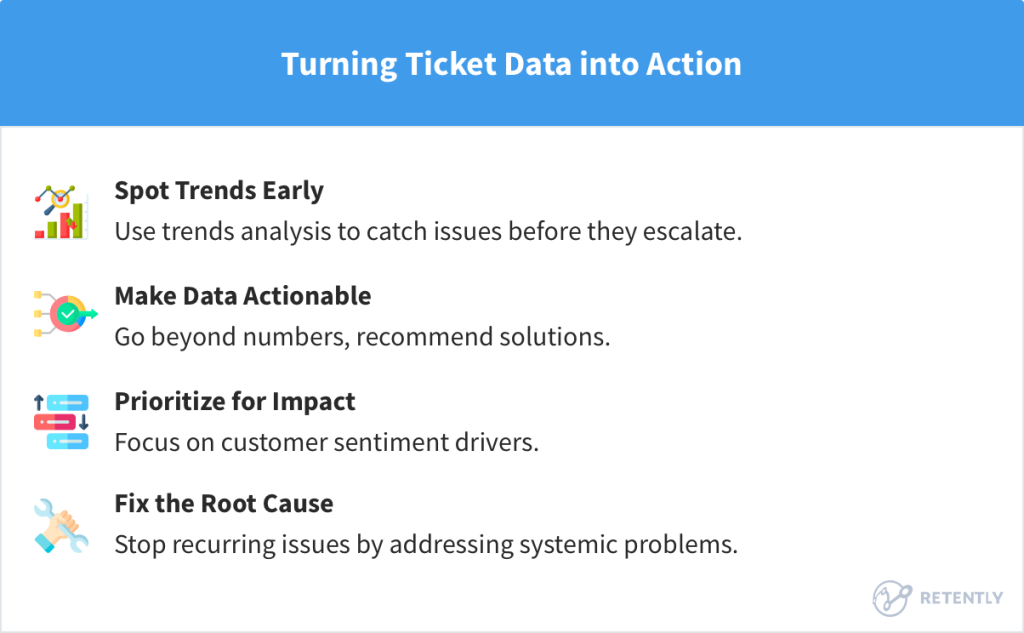
🔍 Wrapping Up: Turning Ticket Data into Action
- Spot Trends Early: Tag analysis helps you catch issues before they spiral.
- Make Data Actionable: Don’t just report numbers – recommend clear next steps.
- Prioritize for Impact: Focus on issues that affect customer sentiment the most.
- Insights should drive real CX improvements: If the same problem keeps showing up, fix the root cause, not just the symptoms.
This approach turns raw ticket data into powerful insights that can drive real improvements in your customer experience.
Next up: Diving into customer reviews, feedback, and how to connect sentiment analysis with CX improvements!
4. Product Review Analysis
Understanding customer feedback isn’t just about reading reviews and survey responses – it’s about spotting trends, identifying pain points, and turning insights into actionable strategies. This section dives into how to analyze review trends and make the most out of NPS, CSAT, and CES data.
Review Volume & Sentiment Trends
Tracking review trends helps you understand how customer sentiment shifts over time. Are people happier after a product update? Did a recent shipping delay cause a spike in negative reviews? Let’s find out.
What to Include:
A. Review Volume Trends: Analyze reviews daily, weekly, or monthly to spot patterns or sudden changes. Monitoring review trends over time helps you:
- Spot sudden spikes in positive or negative reviews after events like product launches, marketing campaigns, or system outages.
- Identify seasonal trends – do returns spike after the holidays? Do shipping complaints increase during peak seasons?
- Detect review droughts, which might indicate decreased engagement or satisfaction.
B. Star Distribution: Track how your average rating changes over time. Is it climbing, stable, or slipping? The average star rating tells part of the story, but it’s the distribution of ratings that uncovers hidden insights. Are most reviews 4-5 stars, or is the average skewed by a few 1-star reviews?

C. Tagging and Categorization of Common Issues: By tagging reviews based on common themes, you can easily track recurring issues and spot trends.
Common Tags:
- ✅ Positive: “Great quality,” “Fast delivery,” “Excellent support”
- ⚠️ Neutral: “Okay product,” “Expected more,” “Decent but overpriced”
- ❌ Negative: “Late delivery,” “Damaged packaging,” “Poor sizing”
D. Review Sources: Different platforms – Yotpo, Okendo, Trustpilot, Google Reviews – attract different types of feedback. Understanding where your reviews come from helps tailor your CX strategies.
For example:
- Yotpo/Okendo: Product-specific reviews, often driven by post-purchase emails.
- Trustpilot/Google Reviews: Brand reputation-focused, broader customer experiences.
- Social Media: Spontaneous feedback, both positive shoutouts and public complaints.

Key Takeaways: Turning Review Data into CX Wins
- ✅ Monitor review trends regularly – spikes can signal product launches, marketing campaigns, or issues.
- ✅ Go beyond star ratings – analyze common themes and customer sentiment.
- ✅ Identify which platforms need attention – don’t just focus on one review site.
- ✅ Close the feedback loop – use insights to improve products, update FAQs, and train support teams.
- ✅ Respond to reviews – whether positive or negative, show customers that you’re listening.
Next up: Diving into NPS, CSAT, CES data for a complete view of your CX performance.
Insights from NPS, CSAT & CES surveys
While reviews give you a glimpse of customer sentiment, direct feedback from surveys like NPS, CSAT, and CES provides a deeper understanding of what’s driving customer satisfaction – or frustration. This section helps transform feedback into actionable insights that can improve products, support processes, and the overall customer experience.
What to include:
- NPS Score Trends: Track NPS over time to see if loyalty is improving or declining.
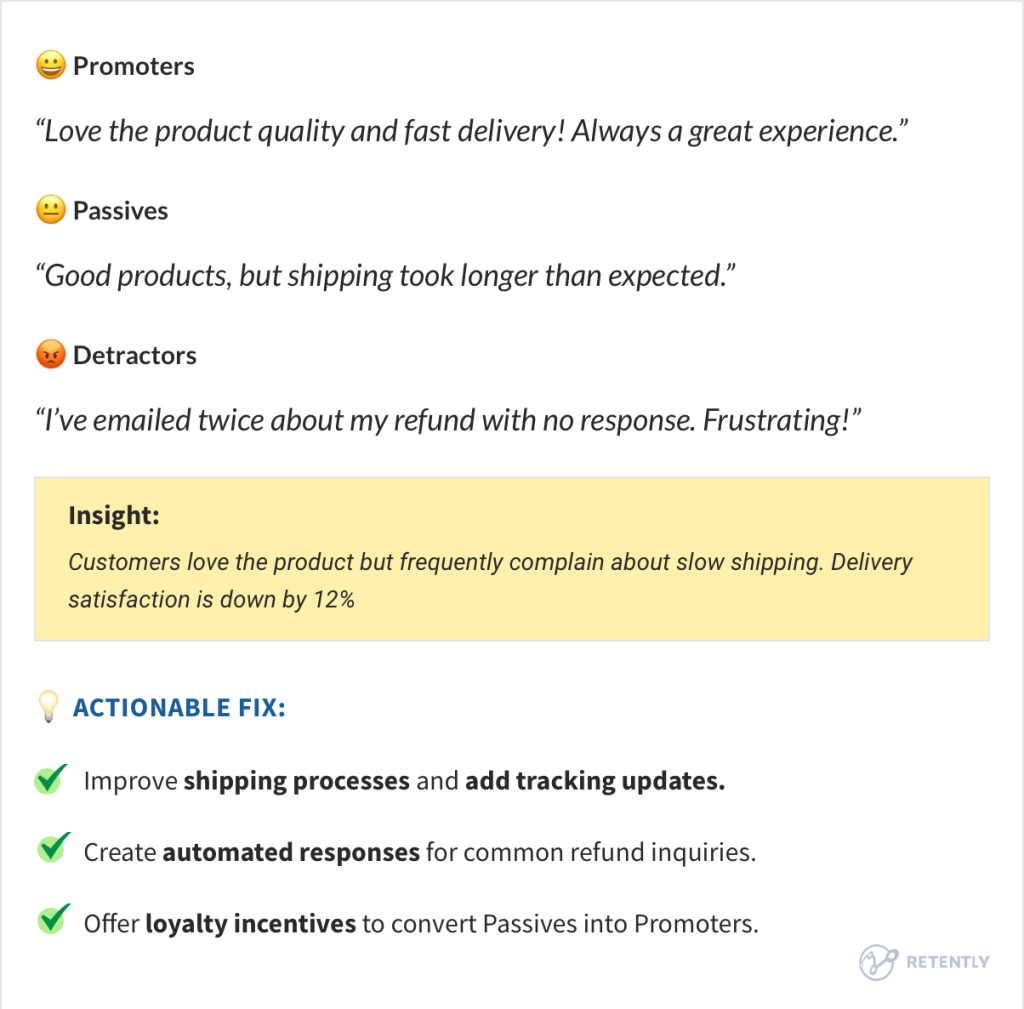
- Breakdown by Segment: Identify the percentage of Promoters, Passives, and Detractors.
- Key Drivers of Feedback: What’s causing high scores? What’s behind negative feedback?
- Real Customer Quotes: Use direct quotes to add context to the numbers.
- CSAT & CES Trends: Analyze customer satisfaction and effort scores post-support – was the issue resolved? How easy was the experience?
Let’s break it down.
A. NPS Score Trends & Insights
Net Promoter Score (NPS) measures customer loyalty and the likelihood of recommending your brand. But the real value lies in analyzing why people gave their scores.
Breakdown of NPS Responses:
- Promoters (9 – 10): Loyal fans who fuel growth.
- Passives (7 – 8): Satisfied but not enthusiastic – easily swayed by competitors.
- Detractors (0 – 6): Unhappy customers who could harm your brand reputation.

B. Real Customer Quotes from NPS Surveys
Including actual customer quotes adds context to the numbers and helps your team connect emotionally with customer feedback.
What’s Driving Satisfaction or Dissatisfaction? Ask yourself:
- Are Detractors concentrated around specific issues? (e.g., slow refunds, product defects)
- What differentiates Promoters from Passives? (Is it just fast support, or are there product-related factors too?)
- Are there recurring issues that could be fixed with simple process improvements?

C. CSAT & CES Trends: Measuring Satisfaction & Effort
Customer Satisfaction (CSAT) and Customer Effort Score (CES) focus on how customers feel after specific interactions – especially after support engagements.
CSAT Trends: What’s Affecting Customer Satisfaction?
- Post-Support Experience: Was the issue resolved effectively?
- Agent Performance: Did the agent listen and provide value?
- Resolution Speed: Was the issue solved quickly?

CES Trends: How Easy Is It for Customers to Get Help?
The Customer Effort Score (CES) measures how easy it was for a customer to get their issue resolved. High effort = low satisfaction, even if the problem is eventually fixed.
Common CES Frustrations:
- Long hold times or slow responses.
- Having to repeat information multiple times.
- Complex return or refund processes.

Key Takeaways: Making Feedback Actionable
- ✅ Break down NPS, CSAT, and CES scores to uncover the real drivers behind customer satisfaction.
- ✅ Use customer quotes to humanize data and highlight recurring issues.
- ✅ Spot trends early – don’t wait for negative feedback to pile up before acting.
- ✅ Focus on continuous improvement – small changes based on feedback can lead to big CX wins.
Next up: Analyzing return and refunds to uncover even more CX insights.
5. Returns & Refunds Breakdown
Returns and refunds are a major cost center for brands but they also offer valuable insights into customer expectations and product issues. Instead of simply tracking the number of returns, a smart CX report digs into why customers are returning products and how to minimize unnecessary returns while improving customer satisfaction.
This section of the CX report helps answer critical questions like:
- ✅ What is the total return rate and the total number of items returned? How much do returns represent as a percentage of total sales along with how many products have been sent back during this period?
- ✅ What are the top reasons for returns? (Sizing issues? Product defects? Unmet expectations?)
- ✅ Are refunds outpacing exchanges? (What’s the financial impact?)
- ✅ Which products have unusually high return rates? (Potential quality or marketing issues?)
- ✅ What proactive steps can reduce returns? (Better product descriptions? Sizing tools? Customer education?)
Let’s break it down.
A. Returns Rate & Reasons
Customers return products for many reasons, but not all returns are equal. Some indicate product defects or quality issues, while others suggest misaligned expectations (e.g., size, color, or fit issues).
For most ecommerce brands, returns typically fall into these main categories:
- Wrong Size/Fit → Customers expected a different size or fit. Common in fashion & footwear brands.
- Product Defect/Damage → The product arrived broken or had a functional issue.
- Item Not as Described → The product looked different online vs. in real life (color, texture, material).
Make sure to include these Top Return Reasons to keep everyone on board.
B. Refund vs. Exchange Ratio – What’s the Financial Impact?
Refunds and exchanges don’t impact the business in the same way. Refunds are a direct loss, while exchanges keep customers engaged with the brand.
Therefore, Refund vs. Exchange Ratio shows whether customers still want the product (exchange) or prefer to walk away (refund) – a key indicator of satisfaction.
Let’s look into a couple of examples:
📌 Example Insight: “90% of defective product returns result in refunds, meaning customers aren’t opting for replacements.”
Actionable Fix:
✅ Offer instant exchanges for defective items instead of refunds.
✅ Provide store credit incentives for returns to encourage repurchases.
📌 Example Insight: “Customers returning items due to sizing issues are more likely to exchange than refund.”
Actionable Fix:
✅ Improve size guides & customer reviews to reduce misfits.
✅ Implement a “Try Before You Buy” program to reduce size-based returns.
C. Customer Behavior Insights – Are Certain Products Driving Disproportionate Returns?
Some specific items might be triggering excessive returns, indicating potential issues with product quality, misleading marketing, or sizing inconsistencies.
📌 Example Insight: “Shoes have the highest return rate (42%), mostly due to incorrect sizing. Customers frequently mention that fit is inconsistent across different styles.”
Actionable Fix:
✅ Add real customer feedback (e.g., “Runs Small” or “True to Size” labels).
✅ Offer a virtual try-on tool or AI-powered sizing recommendations.
✅ Allow customers to upload their measurements for better sizing suggestions.
D. Data Visualization
Include graphs from Return Analytics showing:
- Upsell Rate During Returns: How often are customers opting for upsells instead of refunds?
- Return Trends Over Time: Weekly breakdown of return rates, highlighting spikes or drops.
- Refund vs. Exchange Patterns: Visual representation of how return reasons vary between refunds and exchanges.
Note: Trends can vary by week, providing insights into seasonal patterns, product launches, or promotional impacts.
🔍 Wrapping Up: From Insights to Impact
Reducing returns isn’t just about saving money but creating a better customer experience. Every return tells a story, and if you listen closely, you’ll find opportunities to improve products, policies, and customer satisfaction.
- ✅ Identify Patterns: Look beyond the numbers – what’s driving returns?
- ✅Prioritize Impact: Focus on high-return categories that affect your bottom line the most.
- ✅Act Fast: Don’t wait for trends to grow – adjust return policies, improve product info, and optimize packaging proactively.
Next stop: Digging into delivery and logistics performance.
6. Delivery & Logistics Performance
While great products and stellar customer service are crucial, delivery and logistics performance can make or break the customer experience – especially in ecommerce. While not all CX managers track delivery insights closely, delayed shipments, poor tracking, and damaged goods often lead to frustrated customers, increased support tickets, and even negative reviews.
This section of the CX report focuses on how well your delivery operations are performing, how they’re impacting customer satisfaction, and where you can improve.
A. Shipment Delays & On-Time Delivery Rate
The on-time delivery rate is one of the most important logistics KPIs. It measures how many orders were delivered within the promised timeframe. When delays happen, it’s important to know where, why, and how often. When this number drops, expect a spike in support tickets and customer complaints.
Key Metrics to Track:
- 📦 On-Time Delivery Rate: % of orders delivered on or before the promised date.
- ⏱️ Average Delivery Time: How long it takes from order confirmation to delivery.
- 🚩 Late Delivery Rate: % of orders delivered after the expected date.
- 📨 Delivery-Related Support Tickets and Customer Feedback: Correlate delivery delays with support ticket volume and customer feedback.

B. Carrier Performance Overview
Not all carriers perform equally. Tracking carrier-specific performance helps identify which partners are reliable and which ones are causing customer frustration.
Key Carrier Metrics to Analyze:
- 🚚 On-Time Delivery Rate by Carrier
- ⏱️ Average Delivery Time
- 📉 Failed Delivery Attempts
- 🎟️ Carrier-Related Support Tickets

C. Regions Experiencing Delivery Issues
Delivery problems aren’t always carrier-related, they can also be regional due to infrastructure, weather, or customs delays (for international shipments).
What to Include:
- Hotspot Regions for Delays: Identify specific cities, regions, or countries where delays are most common.
- Root Causes: Are delays due to local carrier issues, customs holdups, or weather disruptions?
Key Metrics to Track:
- 📍 Late Delivery Rates by Region
- 📦 Return-to-Sender Rates
- 🚩 High-Risk Delivery Zones

D. Customer Complaints About Shipping & Handling
Analyzing shipping-related complaints helps uncover recurring issues that affect customer satisfaction.
Common Complaint Categories:
- 🚚 Late Deliveries: “My package arrived two weeks late!”
- 📦 Damaged Goods: “The box was crushed, and the product was broken.”
- 🗺️ Tracking Issues: “The tracking number hasn’t been updated in days.”
- 📬 Missed Deliveries: “The courier didn’t leave a note, and now my package is missing.”

Key Takeaways: Making Delivery Data Actionable
- Monitor Regularly: Delivery performance can shift quickly – monthly tracking helps you stay ahead.
- Data-Driven Decisions: Use carrier and regional data to optimize shipping strategies and improve customer satisfaction.
- Communication is Key: Even if delays happen, proactive updates can help maintain customer trust.
Next up: Bringing it all together – how to align priorities, set goals, and create action plans based on CX reports.
7. CX Strategy: Key Takeaways & Action Plan
After diving deep into the data, it’s time to connect the dots and turn insights into actionable strategies. This section helps align CX goals across teams, ensuring everyone knows what to focus on to improve customer experience.
Pattern Identification & Emerging Trends
The goal here is to spot recurring issues and emerging trends that might not be obvious at first glance. This helps identify areas where small changes can lead to big improvements.
What to Include:
- Cross-Functional Insights: Are there trends that affect more than just the support team? Maybe marketing is setting expectations that the product doesn’t meet, or shipping issues are driving support tickets.
- Recurring Pain Points: Identify common issues that keep popping up – these are opportunities for long-term fixes.
- Impact of Product Launches: Do new products or features cause spikes in tickets? This might suggest gaps in user education or product readiness.
- Marketing’s Role: Are campaigns creating confusion or setting unrealistic expectations that lead to customer complaints?
Priorities & Next Steps
Now that we know what’s happening, let’s outline clear priorities and actionable next steps. This keeps CX teams (and other departments) focused on what matters most.
What to Include:
- CX Team Focus Areas: What should the support team work on in the next week or month?
- Cross-Department Collaboration: Which issues require help from marketing, product, logistics, or IT?
- Policy & Product Improvements: Based on trends, are there any processes, policies, or product updates needed?
Setting clear, measurable goals ensures progress is trackable and aligned with business objectives.

Final Takeaways: Turning Strategy Into Action
- Connect the Dots: Don’t just report numbers – analyze patterns across departments to understand the full story.
- Focus on Impact: Prioritize initiatives that will have the biggest effect on customer satisfaction.
- Collaborate: CX doesn’t exist in a silo – working with other teams is key to solving systemic issues.
- Set measurable goals: Track progress to ensure accountability.
- Keep evolving: Customer expectations change, so your CX strategy should, too!
By identifying patterns, setting clear goals, and fostering cross-functional collaboration, your CX strategy becomes more than just a report – it becomes a roadmap for continuous improvement.
8. Dynamic Reporting: Adapting to Emerging Issues
CX reports aren’t meant to be static. Customer experience is constantly shifting, and issues that dominate one month might not even appear the next. That’s why a well-structured CX report should be dynamic – customized based on the challenges that arise.
Rather than following a rigid format, reports should evolve based on the most pressing issues flagged in customer interactions, reviews, and support tickets.
How Dynamic Reporting Works
Instead of cramming the same sections into every report, adjust the structure based on what’s happening in real time. This ensures that teams focus on solving actual problems rather than tracking irrelevant metrics.
Here’s how it works in practice:
A. If There’s a Spike in Fulfillment Errors…
- A new section should appear detailing the types of fulfillment errors (e.g., wrong items shipped, incomplete orders).
- Breakdown by warehouse, supplier, or SKU to pinpoint where the issue is coming from.
- Customer complaints & impact on CX scores.

B. If a Specific Product Color/Version Has Quality Issues…
- A defect report should automatically be included.
- Data should focus on return rates, customer complaints, and defect patterns tied to the issue.
- Recommendations should be tailored to adjust quality control or issue a proactive customer communication.
C. If Customers Are Upset Over a Marketing Campaign…
- If support tickets & reviews mention an ad campaign negatively, a Marketing Impact Analysis section should appear.
- The report should analyze:
- Sentiment around the campaign (positive vs. negative mentions).
- Misalignment between ad promises and reality.
- The resulting increase in support volume (e.g., “I thought shipping was free?”).
Why This Matters
- CX isn’t one-size-fits-all. The most useful reports adapt to current trends rather than following a rigid template.
- It keeps teams focused on what actually matters. No need to analyze returns if that’s not a problem this month – but if it spikes next month, it’ll be in the report.
- It aligns stakeholders. Dynamic reports ensure Marketing, Product, Logistics, and Support all get relevant insights when they need them.
By keeping it flexible and data-driven, teams can stay ahead of customer frustrations, solve problems faster, and continuously improve the experience. CX isn’t static. Your reports shouldn’t be either.
Best Practices for Making Stakeholder Reports Valuable & Engaging
A CX report shouldn’t just sit in an inbox, it should drive action. The key? Making it clear, concise, and relevant to your audience. Whether it’s executives looking for big-picture trends or support managers focused on operations, your report should turn data into insights and insights into action.
Here’s how to create reports that people actually read, and more importantly, act on.
✅ Know Your Audience: Tailor reports to each stakeholder group. Executives want high-level trends and strategic insights, while support managers need operational metrics.
✅ Start with a Summary: Begin with a concise executive summary highlighting key takeaways, trends, and recommended actions.
✅ Focus on Trends, Not Just Snapshots: Don’t just show this month’s numbers – compare them to historical data to identify patterns.
✅ Prioritize Actionable Insights: Every report should answer:
- “What’s working?”
- “What’s not?”
- “What should we do next?”
✅ Keep It Visual & Simple: Use clean, clutter-free layouts. Avoid data overload – focus on what matters most.
✅ Highlight Wins & Opportunities: Celebrate successes as much as you flag issues. Positive reinforcement keeps teams motivated.
✅ Use Visual Dashboards for Clarity
- Replace long tables with clear, intuitive charts – bar graphs for ticket trends, pie charts for NPS breakdowns, heat maps for regional performance.
- Highlight key metrics at a glance with KPI cards that show current values, trends, and targets.
- Incorporate color-coded indicators (e.g., green for positive trends, red for issues needing attention).
✅ Add Context with Qualitative Insights
- Pair numbers with real customer quotes to humanize data.
- Include “Insight” and “Action Plan” sections after each data set to guide decision-making.
- Use case studies or customer stories to illustrate trends in a relatable way.
Wrapping Up: The Power of CX Reports in Driving Business Growth
At the heart of every CX report is a simple truth: behind every number is a real customer.
- NPS isn’t just a score – it’s a measure of customer loyalty.
- CSAT isn’t just a percentage – it’s the voice of a customer who had a great (or not-so-great) experience.
- Support tickets aren’t just “issues” – they’re opportunities to improve.
Encourage your CX teams to look past the metrics and ask deeper questions:
- “What emotions are driving this feedback?”
- “How did this issue make the customer feel?”
- “What can we learn from this to create better experiences?”
When CX reports are driven by a genuine desire to understand and serve customers better, they become more than just reports – they become roadmaps for growth.
But tracking, analyzing, and acting on this data shouldn’t slow you down. Percepto simplifies CX reporting by automating data tracking, generating insightful reports, and delivering scheduled updates straight to Slack and email.
📊 Track CX trends effortlessly → Monitor daily, weekly, and monthly insights in one place.
📢 Stay proactive with automated reports → Get key CX data when you need it, no manual digging required.
🚀 Empower teams with real-time updates → Deliver insights where your team works (Slack, email) so they can act fast.
CX insights shouldn’t just live in dashboards – they should drive action. Use Percepto to transform raw data into better customer experiences. Start tracking smarter today!

 Christina Sol
 Alex Bitca


 Greg Raileanu