Table of Contents
In a highly competitive environment, assessing the success of a DTC brand just by checking the revenue and customer lifetime value is not enough. Predicting customer behavior and future growth is essential, and multiple methodologies are available to achieve this.
RFM and NPS are widely used in ecommerce for these purposes. RFM stands for Recency, Frequency, and Monetary value and is an efficient analysis model that allows brands to gauge and identify high-value customers for further targeting. Analysis of purchase frequency and timing provides a clear picture of buyers’ future actions, allowing the calculation of future revenue.
Yet, while observation is arguably the most straightforward approach to forecasting customer behavior, it still requires significant effort. For a quicker result, NPS will do the job as it assesses customer attitude and loyalty to the brand. As a result, the higher the score, the higher the likelihood of future purchases.
While different in their approach, NPS and RFM are important metrics that help ecommerce businesses better understand their customers and drive growth. In this article, we’ll explore the workings of these models, find out whether there’s any link between them, and how brands can leverage them to gain insights into customer behavior and experience.
Key Takeaways
- RFM analysis helps segment customers based on their behavior, while NPS reveals their loyalty and likelihood to recommend. Together, they give a holistic view of customer value and satisfaction.
- Combining RFM segments with NPS feedback enables highly personalized retention, upselling, and cross-selling strategies tailored to customer needs and preferences.
- By identifying at-risk customers through low RFM scores and negative NPS feedback, businesses can take timely actions to prevent churn and improve customer retention.
- NPS feedback provides qualitative insights that, when paired with RFM data, allow businesses to improve customer experience for specific high-value segments.
- Integrating RFM and NPS into ecommerce growth strategies helps prioritize efforts on high-value customers and maximize ROI, leading to sustainable growth.
What Is NPS?
NPS, or Net Promoter Score, is a popular metric that serves as a measure of customer satisfaction, loyalty, and advocacy. A simple question, “On a scale of 0-10, how likely are you to recommend our company to a friend or colleague” is used to assess the success of a business and the loyalty of its customers.
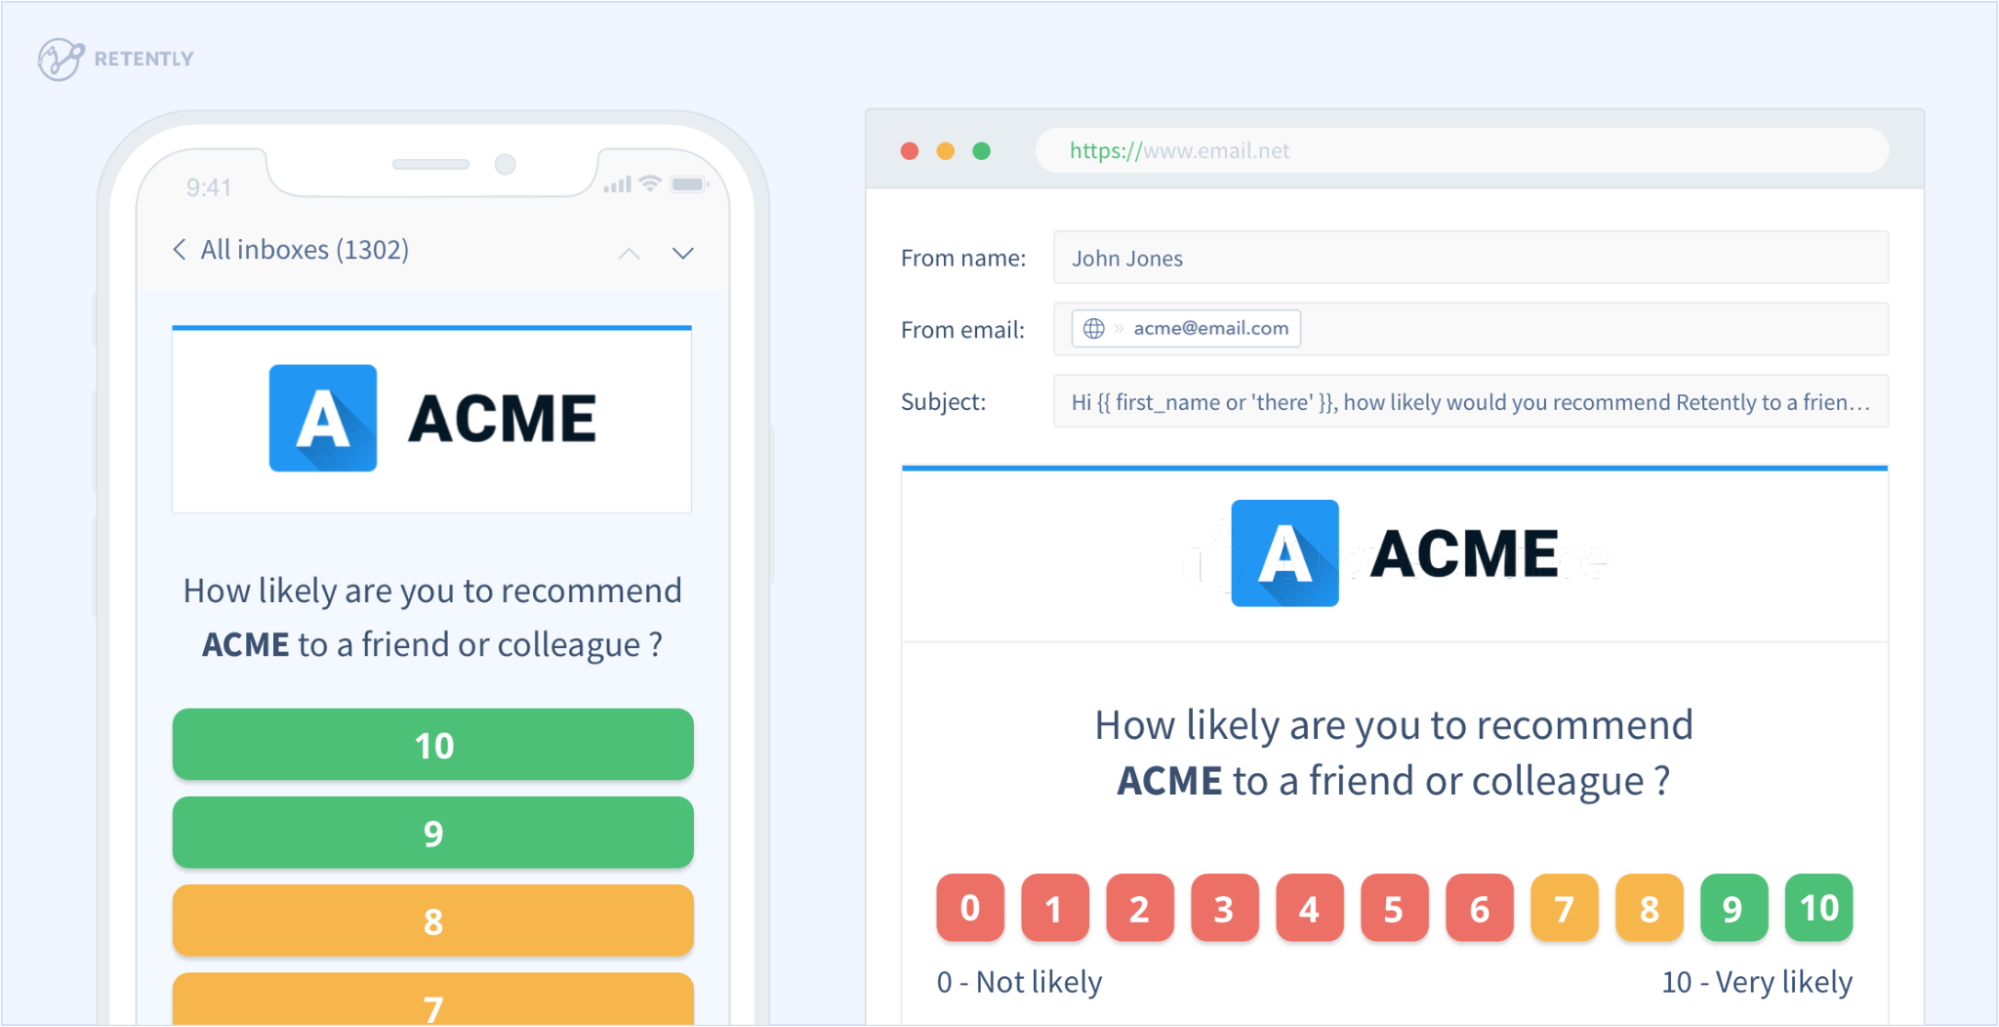
Respondents are grouped into three categories based on their answers. Customers who rate 9 or 10 are the Promoters, as they genuinely love your product. Passives choose between 7 and 8, and while they may keep buying, they will quickly turn to a competitor. Anyone giving a score of 6 or lower is considered a Detractor – a dissatisfied customer who will likely purchase again only if you take appropriate steps.
Your NPS score is the difference in percentage between Promoters and Detractors. For example, if 55% of our customers are Promoters, and 15% are Detractors, your NPS is 55%-15%=40%. It’s worth mentioning that companies with high NPS show higher growth rates, which is natural since satisfied customers are willing to recommend the business to others. That translates into increased sales, positive word-of-mouth, and a strong brand reputation.
The rating is followed up by open-ended questions that provide more details on the reasons for customer satisfaction or dissatisfaction. The captured feedback helps concentrate efforts on the most relevant business areas, identify any difficulties customers may face, and single out customers who will gladly promote the brand or never purchase again.
Another important consideration is that NPS facilitates customer segmentation, which, in turn, simplifies marketing efforts by providing clarity on the specific follow-up required for each group. Promoters are the right customers for cross-selling, upselling, and referral programs. Passives need further encouragement and will be happy with discounts and additional offers to keep them engaged. Winning Detractors will require more work, but solving their concerns will allow reaping benefits later.
The NPS concept is based on customer self-assessment, which leaves out biases and assumptions while giving relevant and actionable feedback for ecommerce businesses willing to improve customer experience and reduce churn.
What Is RFM?
RFM (Recency-Frequency-Monetary) is a customer segmentation model used to identify and target high-value customers. The RFM concept differs from NPS as it relies on the data gathered by marketers and salespeople, yet, it is another way to measure customer value.
Understanding the Key Factors
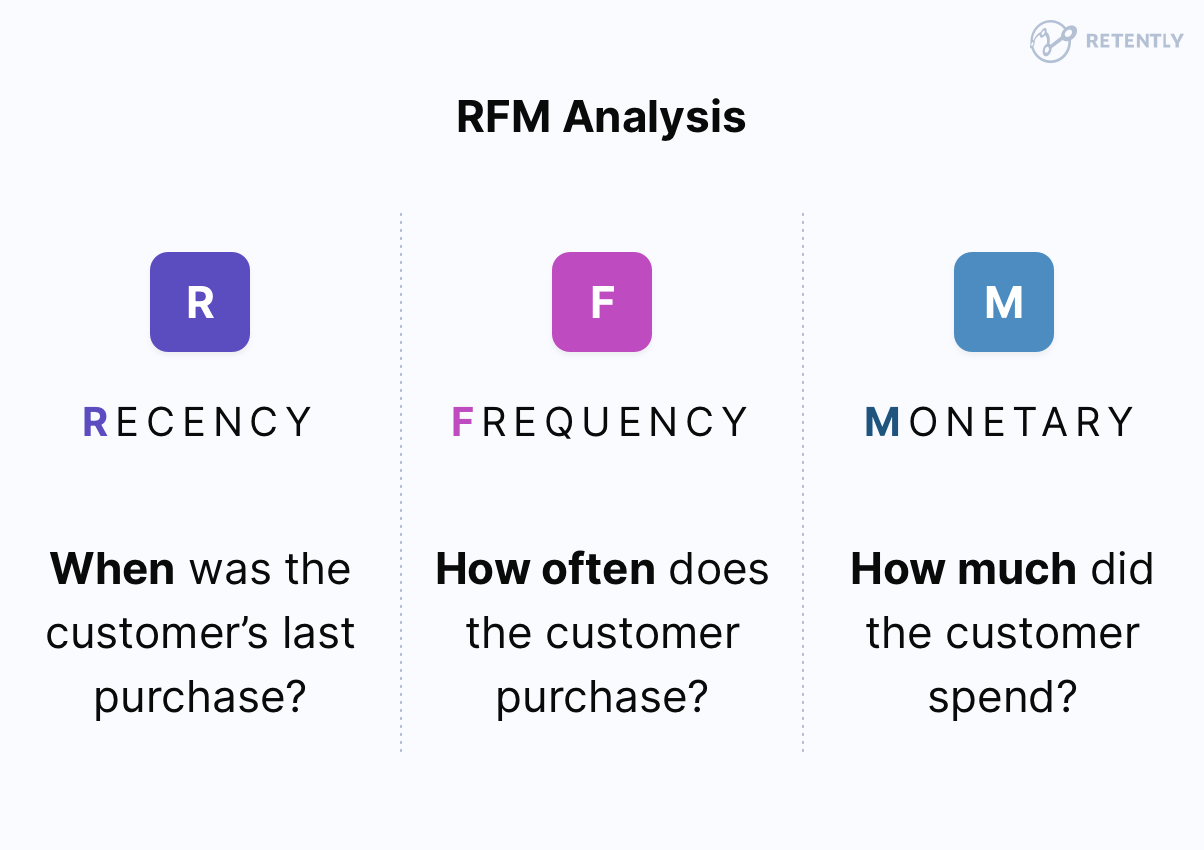
As the name implies, the RFM model relies on three key factors:
- Recency: When did the last purchase occur? Customers who have made a more recent purchase are more likely to return than those who have not purchased in a long time.
- Frequency: How often does a customer purchase? Customers who make frequent purchases are more likely to be loyal and purchase more.
- Monetary value: How much money did your brand earn from a customer? Those who spend more on their purchases will likely be more valuable.
The RFM model assigns a score to each customer by analyzing these factors. The scores segment buyers into groups, including high-value, loyal customers and those targeted for improvement.
How to calculate RFM?
When doing the RFM analysis, you will naturally want a list of customers who buy frequently and spend the most. Just like in the case of NPS, there is a way to calculate the RFM value of every customer. Usually, marketers use a 1-5 (the standard) or 1-10 scale and assign scores based on every parameter, with a year as a timeframe. A 1-10 scale allows for more granularity but can also increase the complexity of the RFM analysis.
Let’s start with Recency. Depending on the specifics of your business and buyer’s journey, you must decide on the time frames, and score ranges to best suit your needs. For example, if you sell clothes and people generally buy anything new every two months, you will give 10 to any customer who purchased during that period. Then keep decreasing the number, giving a 9 to those who bought anything during the last three months, etc. You can continue this pattern for each time frame until you reach a minimum score for customers who have not purchased in a long time.
The same goes for Frequency, which is based on the number of customer purchases over a certain period. In this respect, a customer who makes six purchases a year will receive a higher score than those who purchased once.
As for the Monetary value, 10 goes to those who spend the most. It can be a straightforward calculation considering the total spend in a given period. It may also take into account other factors, such as the average order value or the customer’s lifetime value.
To combine the three scores for Recency, Frequency, and Monetary value into a single RFM score, you can use different methods depending on your brand’s specific needs and goals. There is no one-size-fits-all approach to this.
To calculate the RFM score, brands can combine the assigned value to each of the three factors.
Now, if you have given a customer 8 on Recency, 5 on Frequency, and 5 on Monetary, the three-digit score is 855.
Another method is averaging the three scores. Based on our example, this would result in: (8+5+5)/3=6. Naturally, customers with higher scores are considered more valuable. These are the most common approaches used.
Depending on the nature of your business, Frequency may be insignificant, and you may want to decrease its influence on the final score. In this case, you may use a different scoring scale to measure it, but you must adjust the formula accordingly.
Hence, another standard method is to assign weights to each of the three scores based on their importance and add them up.
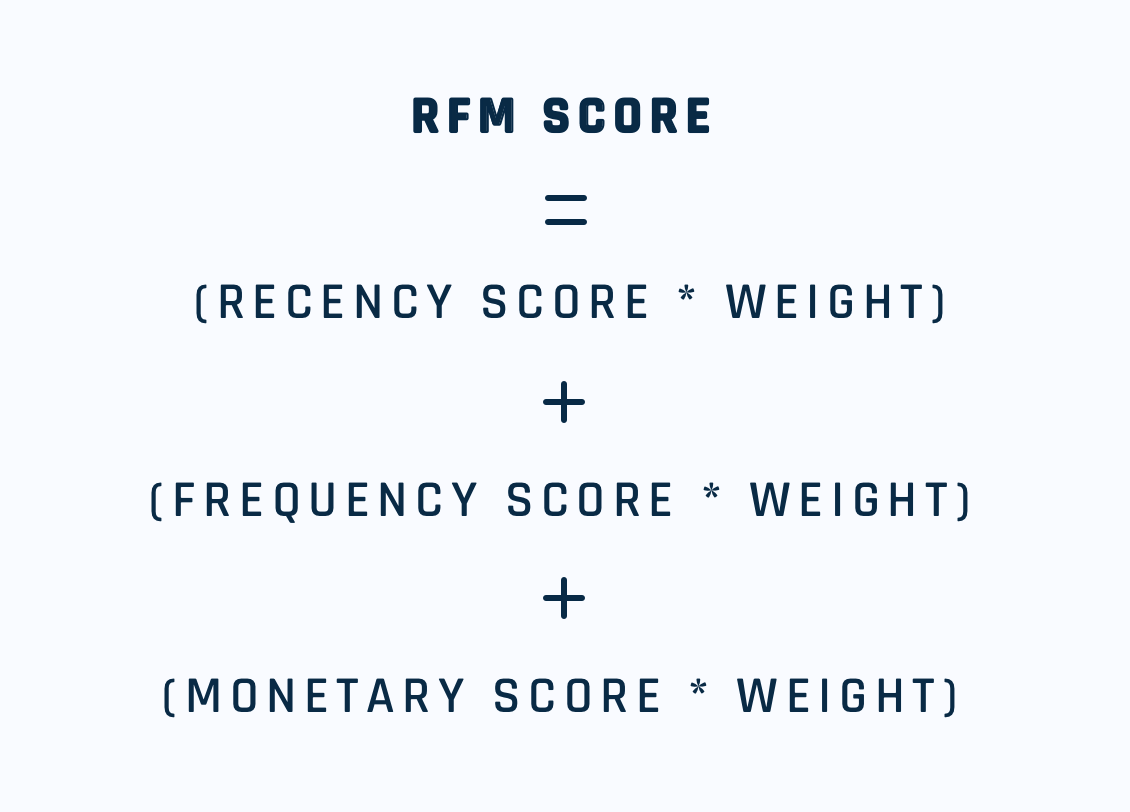
For instance, if Recency is deemed more critical than Frequency and Monetary value, you could assign a weight of 60% to Recency, 30% to Frequency, and 10% to Monetary value. Then, you would multiply each score by its corresponding weight, add up the results, and get a final weighted RFM score.
Analyzing the same example, we would get:
RFM score = (8 x 0.6) + (5 x 0.3) + (5 x 0.1)
RFM score = 6,8
Regardless of the favored method, make sure to apply it consistently across your customer base.
Benefits of the RFM model
Analyzing RFM data has multiple benefits that extend beyond its ability to segment customers and improve marketing efforts. It provides valuable insights into customer behavior that can inform various business decisions.
Just like NPS, it allows projecting future revenue by identifying the expenditures of existing and new customers. This information can guide marketing strategies and improve customer retention efforts.
RFM analysis can provide ecommerce businesses with insights into the most popular products among their customers. By expanding their product offering in that category, they can improve satisfaction levels and prompt positive word-of-mouth. By identifying the most frequent customers and their purchase patterns, brands can also better anticipate demand and adjust their stock accordingly. This way, they can minimize the risk of product shortage.
In addition, RFM can spot opportunities for cross-selling and upselling. Based on the purchasing behavior, companies can single out products frequently purchased together and use this information to offer targeted recommendations to active customers.
It also allows brands to pinpoint the most valuable customers: those making the most frequent and high-value purchases. Ecommerce businesses can use this information to allocate resources more effectively and make strategic decisions that increase customer lifetime value and revenue. Proper data analysis also helps identify patterns in customer behavior to fine-tune existing offers and predict your clients’ needs.
The Link Between NPS and RFM
Are the two approaches really that different, or do they actually share a common thread in the data they provide?
When it comes to the RFM model, it is natural to think that Frequency is the most important characteristic here: you can predict customer behavior just by looking at this data. However, it turns out that Recency is a more reliable metric as it best predicts the likelihood of future purchases. The reasoning is simple: if the transaction was recent, customers have that specific brand in mind and will likely return for new purchases. Clients who haven’t purchased anything for months are less likely to buy again unless targeted by costly marketing campaigns.
As for Frequency, depending on what you sell, it may be a minor characteristic: people buy groceries daily and purchase laptops once in a couple of years. The same is true for the Monetary part: if a client buys an expensive item and never returns, their monetary value may be higher than that of a regular customer who buys frequently but spends less in the same timeframe. That’s why Recency is the most critical parameter, though all three should be taken into account to get a reliable data set.
Recency is important in NPS as well. Usually, the survey is sent immediately or shortly after the transaction to get the most relevant and actionable feedback. It’s when customers are “fresh” and more willing to share comments and suggestions. Consequently, the more you wait to send the survey, the less accurate information you will receive. In addition, you may not get any feedback at all, instead confusing customers with your survey if the interaction happened ages ago.
Anyway, it doesn’t mean you’ll get high NPS scores if you send the survey immediately since many factors influence it, including the quality of your product, delivery, packaging, website experience, and even the customer’s current mood. Still, many companies notice that the NPS decreases when they survey customers who last interacted with them long ago and return to normal after a new transaction.
Of course, given the broad use of NPS, there is an exception to it to consider, which is relevant for subscription-based companies who measure their customer satisfaction on a regular base, let’s say every 6 months. That might also be the case for big-ticket-item ecommerce brands that can inquire about their experience with the product 3 months after the purchase.
Basically, Recency is the parameter that should be considered when using both NPS and RFM models to predict customer behavior, improve their experience, and increase future revenues.
Advantages of a combined NPS-RFM approach in ecommerce
While RFM and NPS are generally used separately, they can provide complementary insights, offering brands a more comprehensive view of their customers. RFM looks into customer behavior based on past purchases, while NPS measures customer satisfaction and loyalty.
Yet, even if Recency in the RFM model is the best predictor of future behavior, it still can’t be taken for granted. To better understand customers, compare the list of people with the highest scores for both RFM and NPS: if the names match, those clients will surely return.
Cross-referencing the results is another way to use both models to your benefit. After you spot the recent customers, checking their NPS survey results and analyzing the feedback is more than recommended. This way, you can predict their behavior and solve any issues they may encounter in good time to ensure they return for future purchases.
The same procedure is relevant for NPS: identify your Promoters and check their Recency score. If they didn’t get a 10 (in case you use a 10-point scale for the RFM analysis), it is time to remind them about your existence and encourage them to visit your website. RFM analysis can help reveal which products they may be interested in for future purchases.
Here are a few more examples of why your brand needs to use RFM and NPS analysis together:
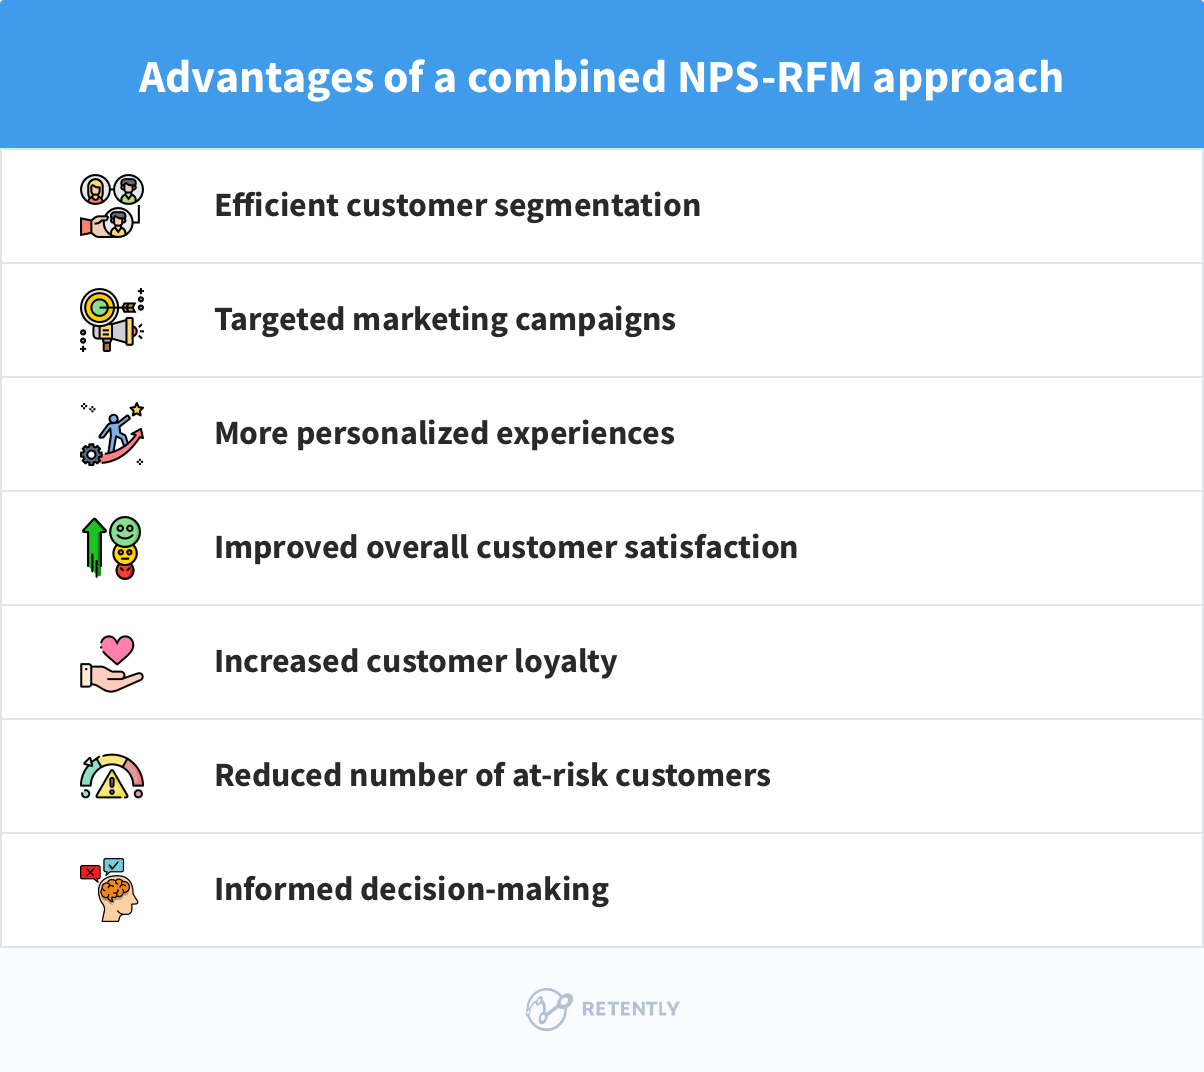
1. Efficiently segment customers
RFM segments buyers based on purchase behavior and engagement level, while NPS seeks to understand each group’s customer satisfaction. For example, customers with high RFM and NPS scores can be classified as loyal advocates. These clients are frequent spenders and vocal advocates for the brand, making them valuable assets for word-of-mouth marketing. Identifying high-value customers can bring many benefits, including effective resource allocation and increased revenue.
2. Build targeted marketing and leverage personalization
By segmenting customers based on their RFM score and NPS rating, ecommerce companies can develop targeted marketing campaigns, personalized product recommendations, and effective customer service strategies. Analyze the data to determine which groups are most likely to respond to specific offers, tailor marketing efforts to each customer segment and address any pain points to improve conversion rates. For example, a brand can use RFM analysis to find customers most likely to purchase a new product and then use NPS data to craft a marketing campaign that speaks directly to their needs.
3. Enable campaign analysis
While RFM can pin the most valuable customers, NPS can assess the impact of a marketing campaign on these customers. In this context, a high NPS score indicates that the campaign resonates with the target audience. The same is valid for loyalty programs.
4. Improve customer experience
By blending RFM scores and NPS feedback, brands can learn why customers are satisfied or dissatisfied with their experience. For example, if you spot Detractors in high-value customer segments, take steps to address their concerns, improve overall satisfaction, and drive positive word-of-mouth. This way, ecommerce businesses can develop products that better meet their needs, while positive word-of-mouth will fuel long-term growth.
5. Increase customer loyalty
While RFM scores can provide insight into the Frequency and Monetary value of customer purchases, they do not directly measure customer satisfaction or loyalty. Yet, NPS singles out the drivers of customer loyalty. By combining these two metrics, brands can determine RFM segments with the highest NPS scores and focus on strategies to improve loyalty within those segments (e.g., reward customers for their loyalty with exclusive offers). By taking steps to retain these high-value customers, you can build long-term relationships and increase the likelihood of repeat purchases.
6. Reduce churn
Via RFM and NPS analysis, brands can determine at-risk customers and engage them with retention campaigns. For example, customers with low RFM and NPS scores are, without a doubt, heading to the front door and requiring special attention. These customers have not made recent purchases, spent little money in the past, and are unlikely to recommend the company to others. Brands can proactively take immediate measures to retain them before it’s too late by addressing their pain points and using targeted offers.
Managing the joint challenges of RFM and NPS
Besides the clear connection between NPS and RFM, there are potential data conflicts to it. Obviously, the two metrics may not always align. A customer who makes frequent purchases may have a high RFM score yet still not be satisfied with specific aspects (like customer support or the ordering process), experiencing a low NPS score. At the same time, a very satisfied customer may still rarely purchase, having a lower RFM score.
Therefore, relying too much on either has its drawbacks. As a brand, you may focus solely on a high RFM score and disconsider NPS, losing customers in the long run. Also, reaching a high NPS score, you may be prone to neglect high-value clients, failing to seize opportunities to boost revenue.
Yet, we’ve got you covered with some tips to follow for the best possible outcome:
- Prioritize CX – RFM analysis can indeed identify valuable buyers but don’t ignore the role of customer satisfaction. Only by adopting a customer-centric approach and using NPS feedback to improve their experience can ecommerce businesses nurture long-term success.
- Look for patterns – As such, patterns offer invaluable insights into customer behavior and preferences, hence when analyzing RFM and NPS data, seek them out. For example, if Detractors are more likely to be low-value customers, this could hint at product value issues or price sensitivity. Make sure you’re not looking at isolated data points but taking a holistic view of how customers interact with your brand.
- Inform decisions – Remove the guesswork and use data to back up decisions. Create a more comprehensive customer profile by cross-referencing RFM and NPS data with other sources such as demographic data, customer service interactions, and social media comments. Ensure that customer data is collected consistently across all touchpoints.
- Treat it as an ongoing process – Customer behavior and preferences are not static, so it’s essential for brands to regularly review data and adjust the RFM and NPS strategies to match their goals. Keep track of key performance indicators and use them to inform decision-making.
- Leverage automation – RFM and NPS data analysis can be challenging and time-consuming, especially if done manually. And while for smaller shops, a manual approach might still work, things will get complicated as they scale their business and larger data sets pour in. Specialized tools can streamline the process and reduce data errors, empowering brands to respond more effectively to ever-changing customer needs.
Ready to Measure Your NPS?
Running a successful ecommerce business isn’t as easy as it sounds, right? Between attracting new customers, keeping the ones you have, and staying ahead of competitors, the challenges can feel endless. One big hurdle? Understanding your customers well enough to keep them coming back for more.
Here’s the thing: growth means more than getting more traffic to your site or running flashy marketing campaigns. Real, sustainable growth comes from knowing your customers inside out – what they want, how they shop, and why they stick around (or leave). And that’s where the role of customer insights kicks in.
Although both RFM and NPS center on customer behavior, they approach it differently. RFM focuses on the transactional history, analyzing how recently and frequently a customer has made purchases and how much money they spent. NPS dwells on customer attitude towards the brand, measuring the likelihood of recommending it to others.
Yet, when used jointly, RFM and NPS give ecommerce businesses a more nuanced understanding of their customers. A good grasp of purchase behavior and satisfaction with the brand facilitates informed decision-making, tailored experiences, and improved customer relationships.
Here at Retently, we specialize in NPS surveys: the templates are tailored to match brands’ needs, the computations are done automatically, and the advanced reports help interpret data and detect feedback patterns. In addition, we offer native integrations with your store, email & SMS marketing, customer support, call center, and CDP platforms. Try it out for 14 days to get a new perspective on customer needs and identify new growth opportunities.





 Alex Bitca


 Christina Sol